What a difference just three trading sessions can make. Here we were last Friday seemingly on course to exceed the April highs when suddenly the floor gave way on Monday morning and we sold off for three consecutive days. Of course the financial MSM didn’t miss a beat and immediately trotted out the likes of Stan Druckenmiller, David Tepper, and Jerome Powell who did their very best to jawbone this market lower. Are they right? Is this v-shaped recovery doomed to fail?
Maybe but it would be foolish to jump to conclusions as doubt and confusion is a normal human response after the first ‘hoorrrayyy’ stab higher that usually follows a deep correction.
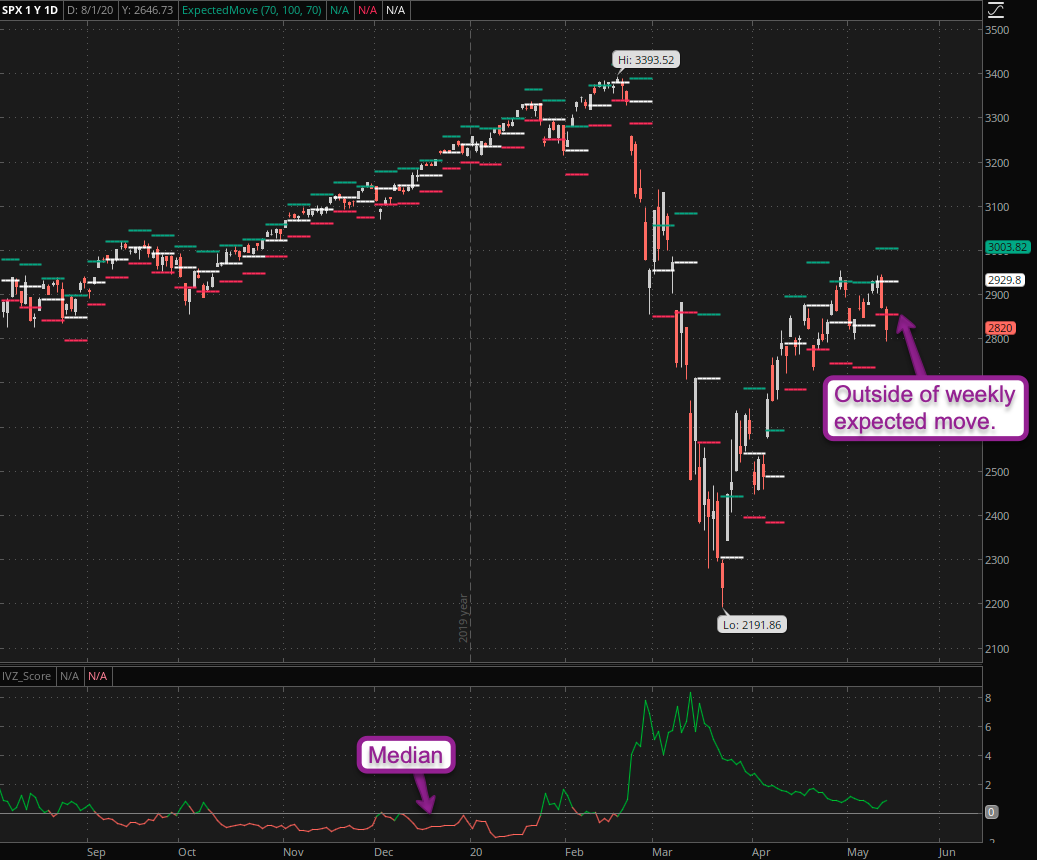
So what do we know? Well for one as of Thursday morning as I’m typing this we know that the SPX has pushed outside its weekly expected move (EM). Should it remain there or – even worse – continue lower from here, then the possibility of a really cold summer could be lurking on the horizon.
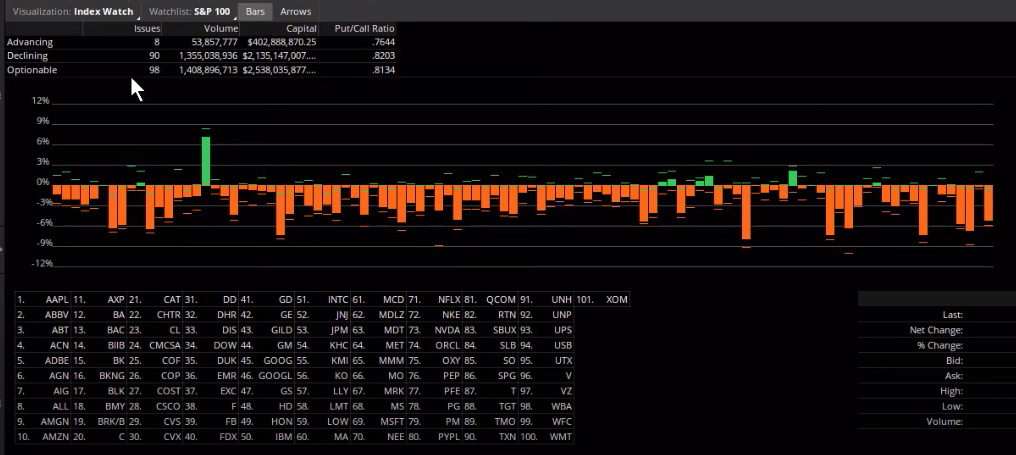
The 8:2 or even 9:1 advance/decline ratio we’ve been seeing repeatedly over the past few weeks was inverted yesterday and that may be good news in disguise in that the bots were sick of treating water below the SPX 3K mark and decided to spice up the game a little.
Let’s Not Forget When We Are
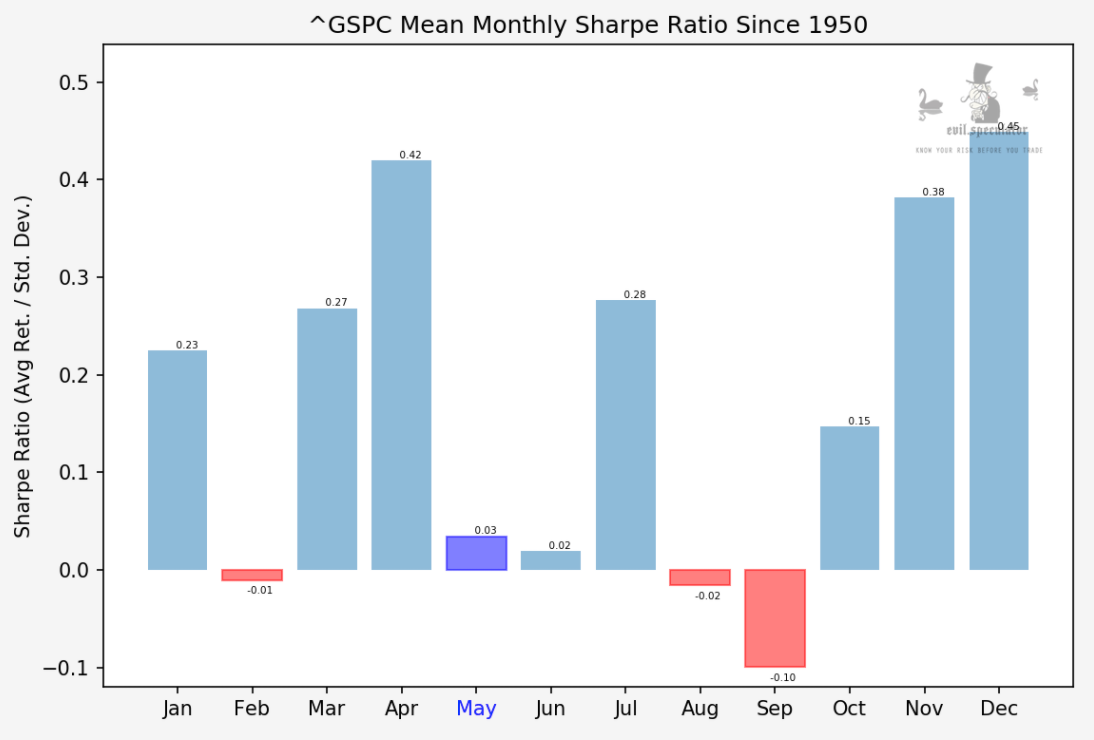
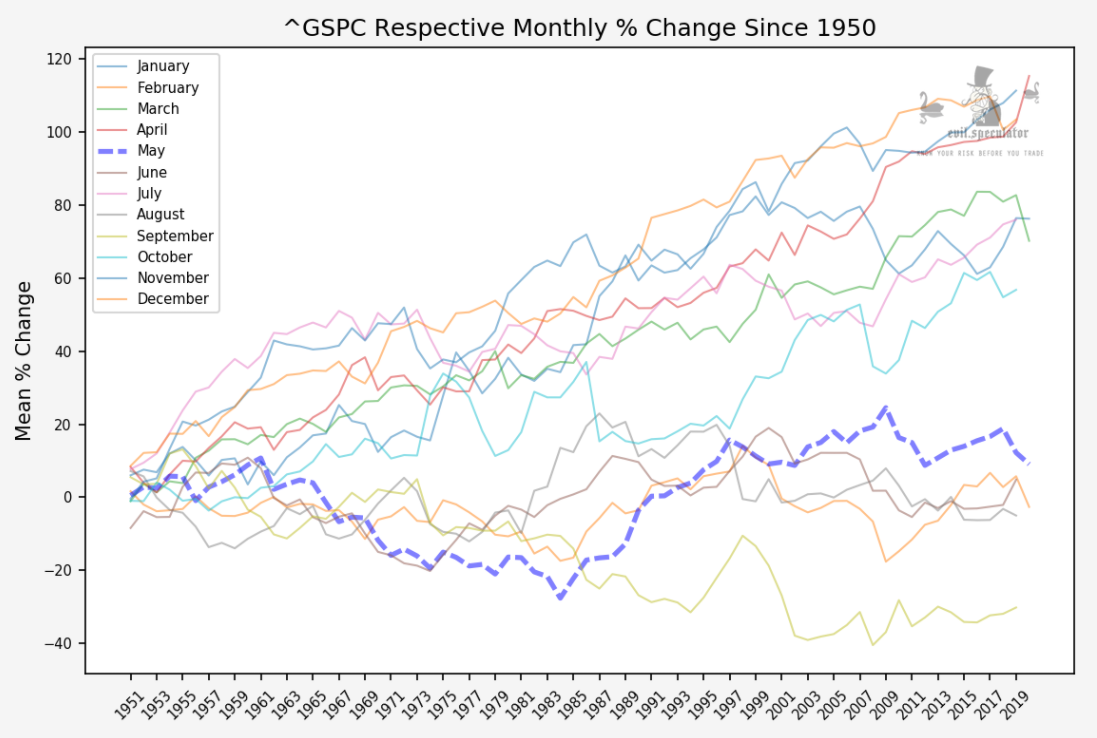
However something many participants seem to have completely forgotten is the fact that May as well as June in general are pretty bad months for equities historically speaking.
How bad? Pretty damn bad judging by the respective monthly comparison.
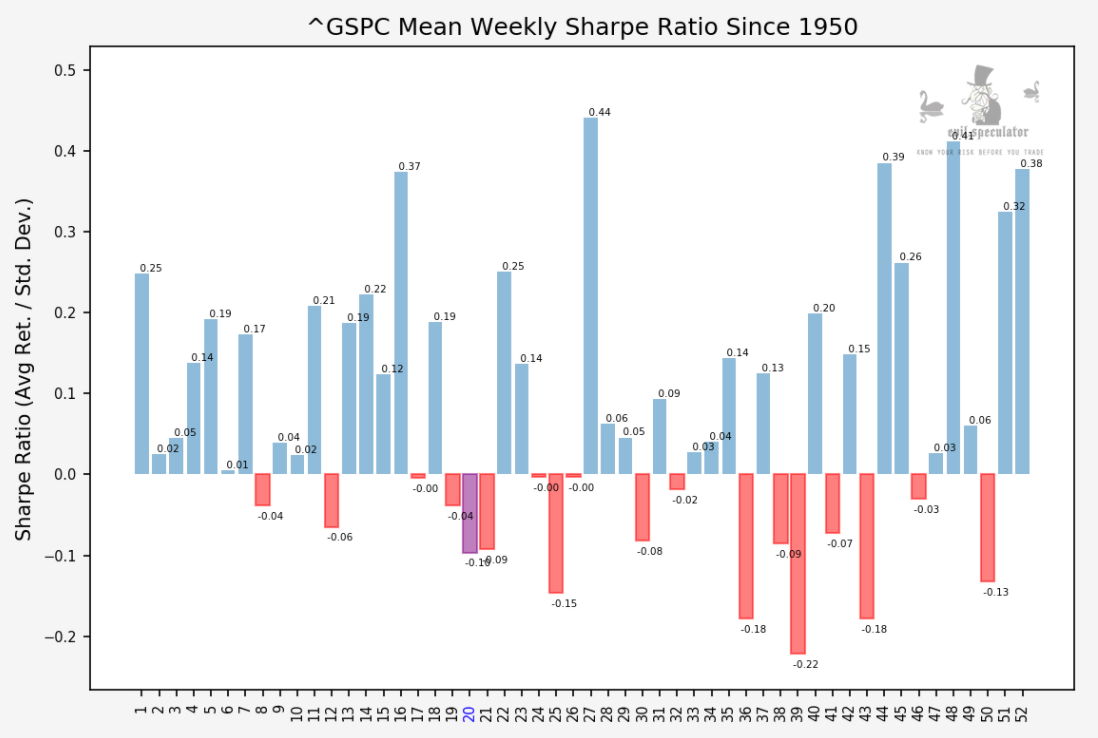
Plus we happen to be in the worst week since December – or the 2nd worst week until the mid year mark.
How often has this week been a loser over the past half century? Well, let me show you:
[MM_Member_Decision membershipId='(2|3)’]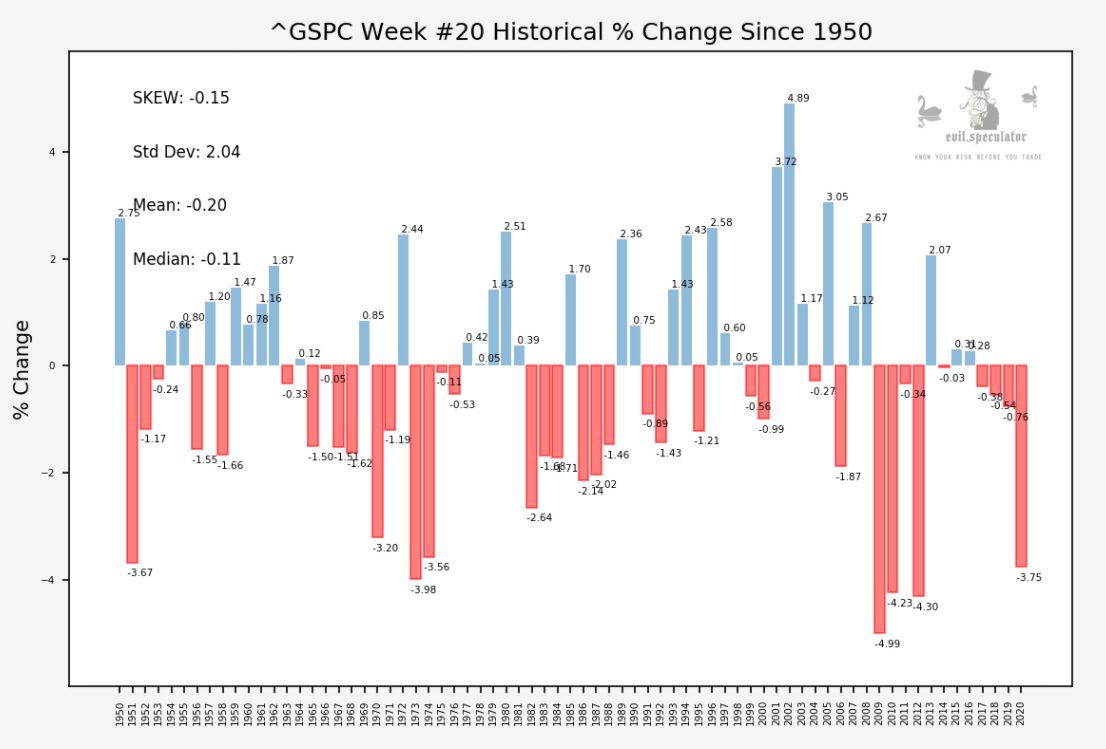
Quite often apparently and the wipe-outs seem to have become more amplified over the past decade. So not only are we in a crappy month (for traders – otherwise I love May) but we are also in its worst week.
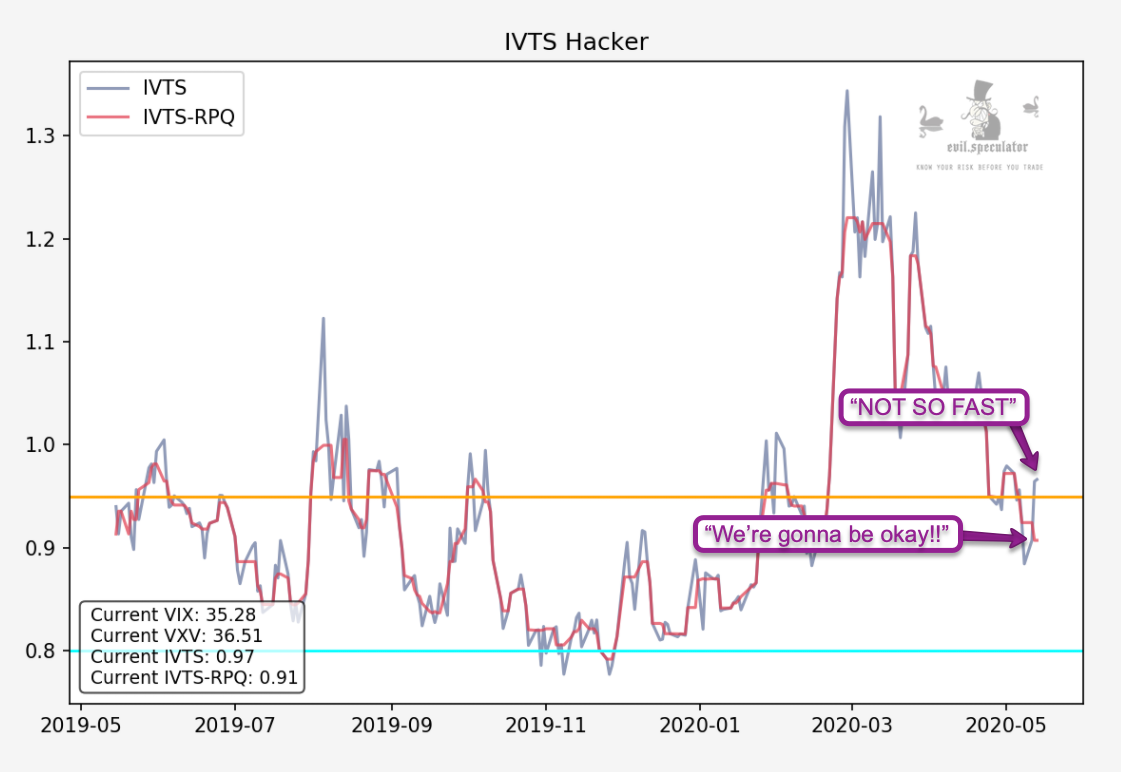
The implied volatility term structure (IVTS) looked like it was back to relative normal with investors sighing a breath of relief. Until Monday that is and now we’re back above the median. I did expect another wave of IV expansion and this could be it.
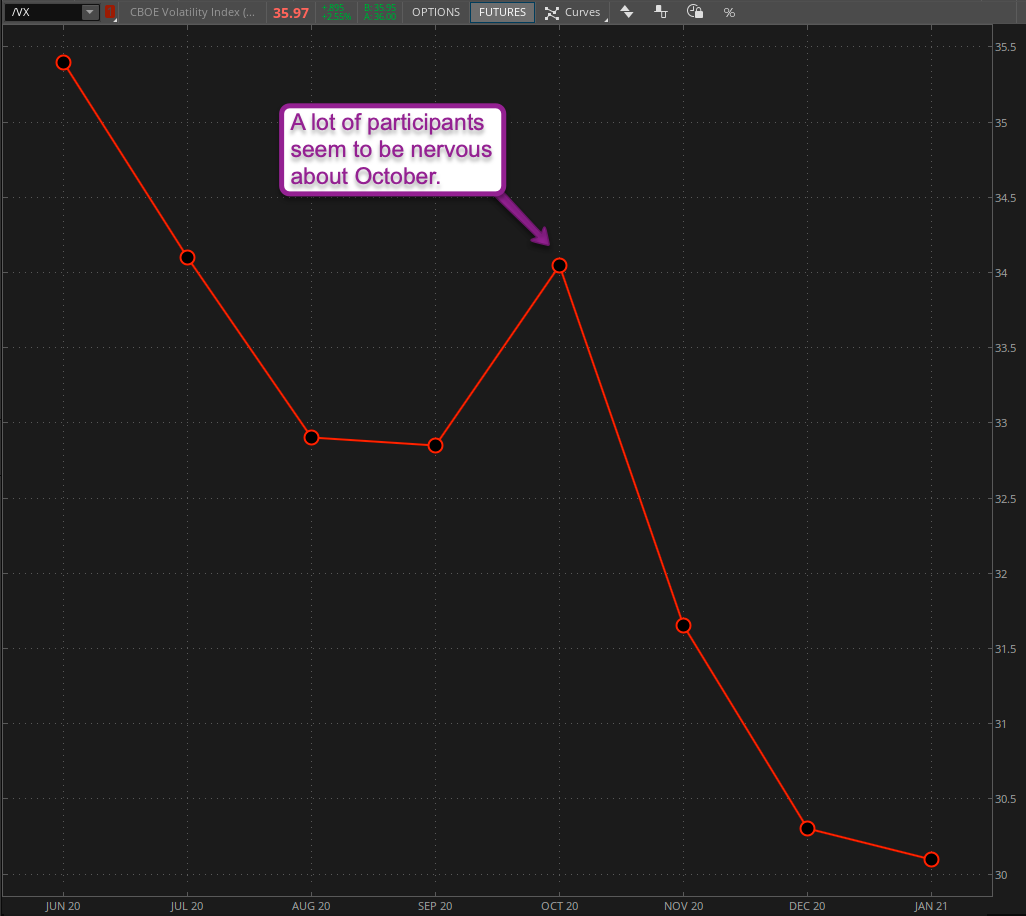
The VX futures product depth shows us a backwardated curve with a suspicious hiccup in the October contract (VX rolls over every month like crude). But just for the record: until we see this one flip back into backwardation we are FAR from a state of normalcy.
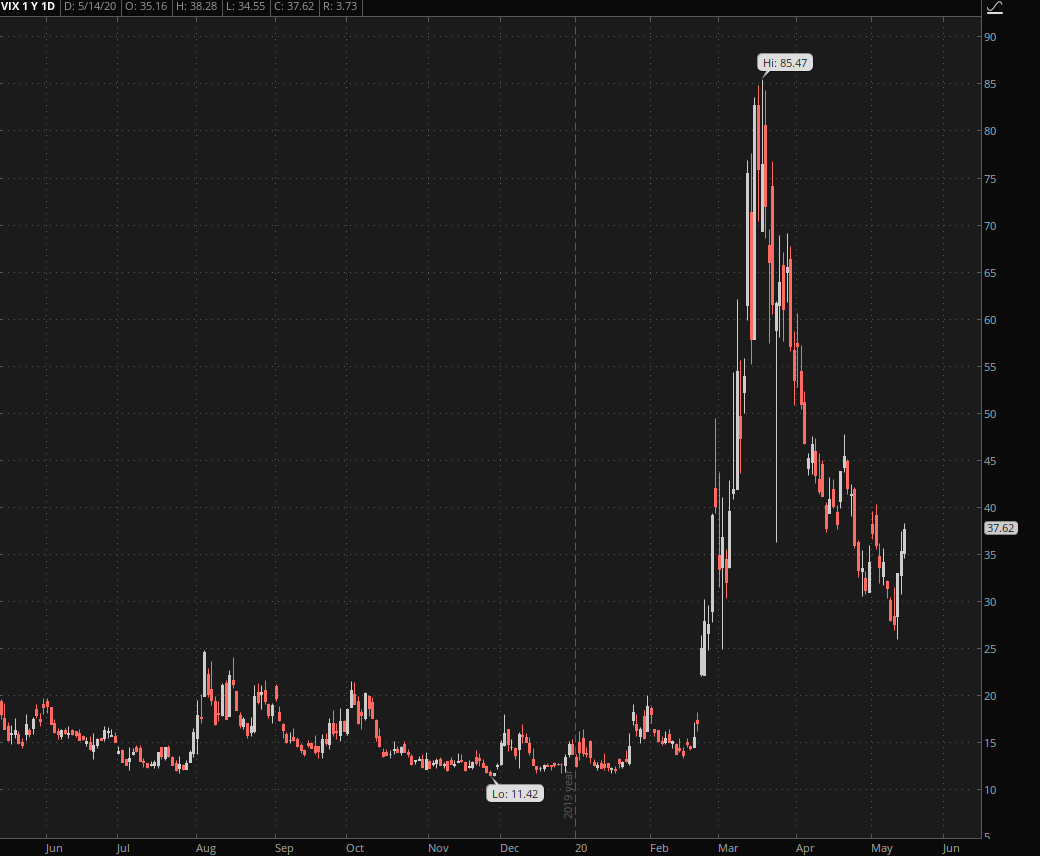
Here’s the raw VIX which pushed into 38 and then backed off a little. Here a breach of the 40 mark would most likely lead to an increase in selling activity. Also, don’t let the VIX fool you if it’s dropping along with equities – that happens 57% of the time with negative returns – and especially after a sudden rise higher.
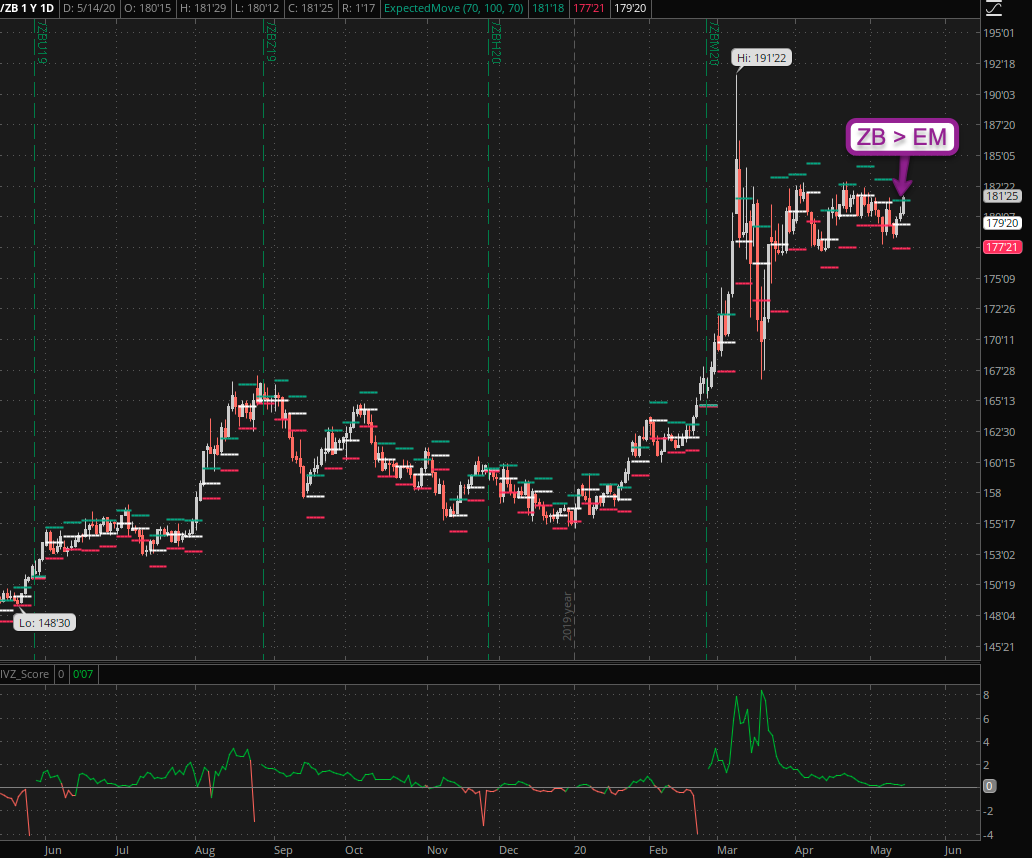
The 30-year bond futures also slightly pushed outside their weekly EM but to the upside. Once again it’s something we’ll have to observe and if it holds until Friday EOS then we may be looking at the makings of a break-out formation here.
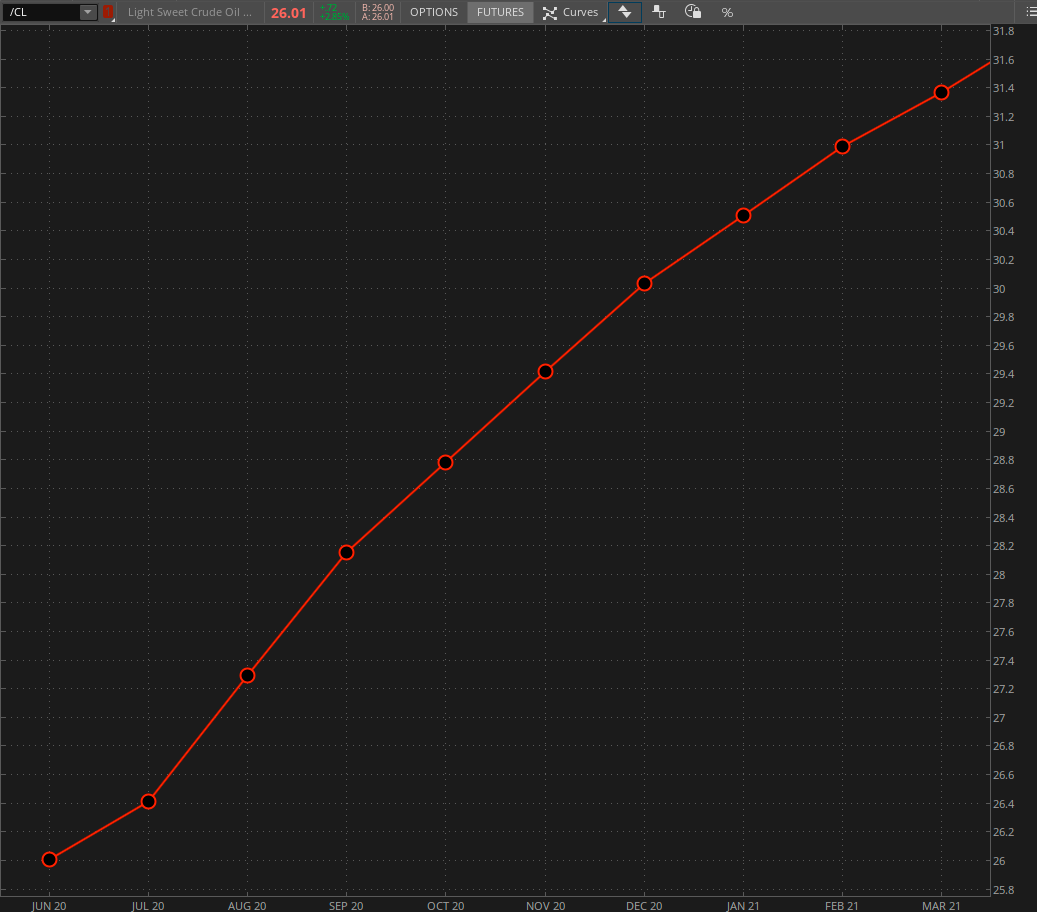
Crude always has my attention as it reflects the demand & supply forces of what makes our world tick and to a certain extent the state of our economy. What gives me reason to be a bit more optimistic is that the June/July ratio has reverted back into relatively normal territory.
When you see the median of about 0 violated then things have a tendency to get out of whack. In retrospect those large swings in late February going into March were an early indicator that we may be looking at trouble ahead. Definitely a chart worth keeping around.
In contrast to the VIX futures the CL curve is in contango as it usually and shows signs of normalization. Of course the economy and the stock market often run orthogonal or at least delayed to each other, so this does not mean that the stock market is not anticipating further trouble ahead over the summer.
Bottom Line:
Before thinking about going bearish across the board we should wait out the week and at least wait for a close outside the expected move. Also the VIX pushing > its 40 mark again would most likely lead to bearish sentiment to become more widespread and drag equities lower.
[/MM_Member_Decision]
[MM_Member_Decision membershipId=’!(2|3)’]
Please log into your RPQ membership in order to view the rest of this post. Not a member yet? Click here to learn more about how Red Pill Quants can help you advance your trading to the next level.
[/MM_Member_Decision]
[MM_Member_Decision isMember=’false’]
Please log into your RPQ membership in order to view the rest of this post. Not a member yet? Click here to learn more about how Red Pill Quants can help you advance your trading to the next level.
[/MM_Member_Decision]


