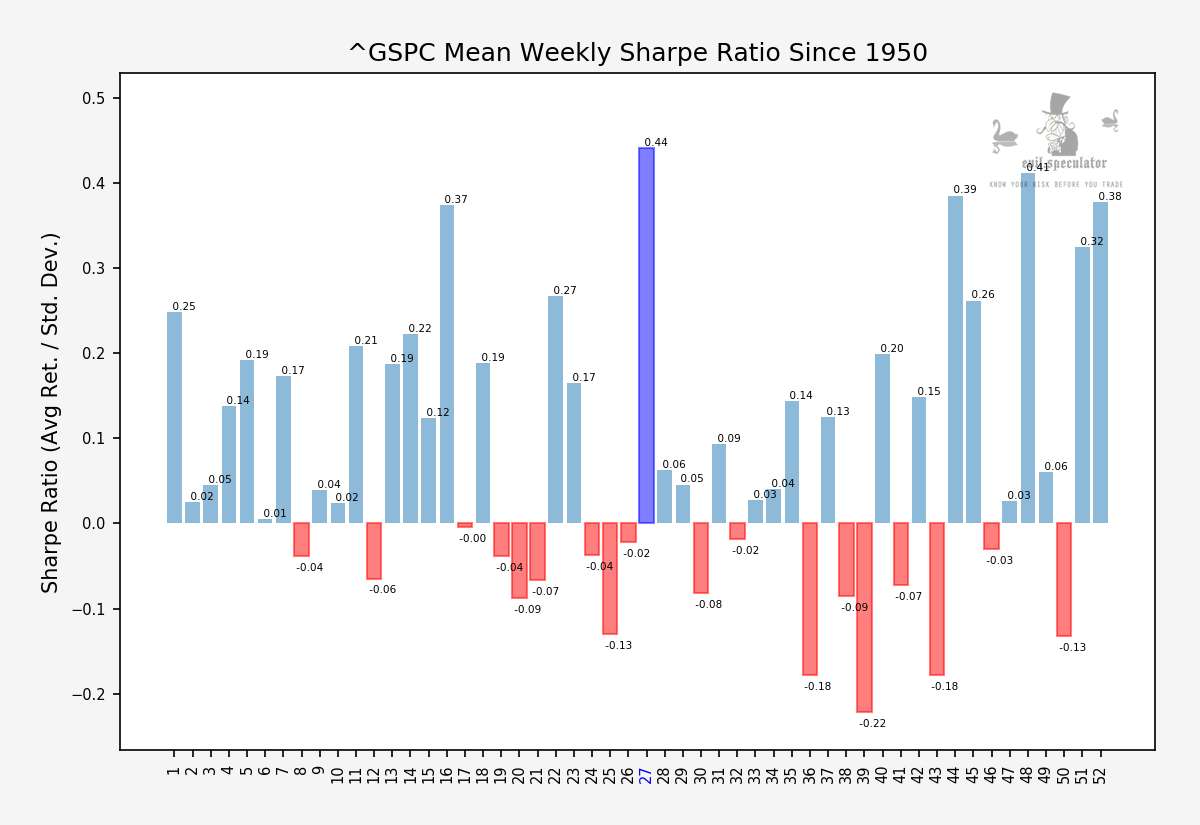
If you had asked me a few years ago which week of the year would be the highest grossing statistically speaking I would most likely have pointed at late November or December. Well, close – but no cigar. After running the stats I was amazed to realize that the biggest winning week happens to follow one of the quietest of the year during – right during the height of the summer vacation season. What gives?
Frankly I don’t know for sure and it maybe it has something to do with week #27 being a short one as the 4th of July weekend beckons. But either way it doesn’t really make much sense given the overall seasonality and the ranges that surround it. In other words – it’s a complete outlier and it towers over everything else in its vicinity like the famed Burj Khalifa in Dubai.
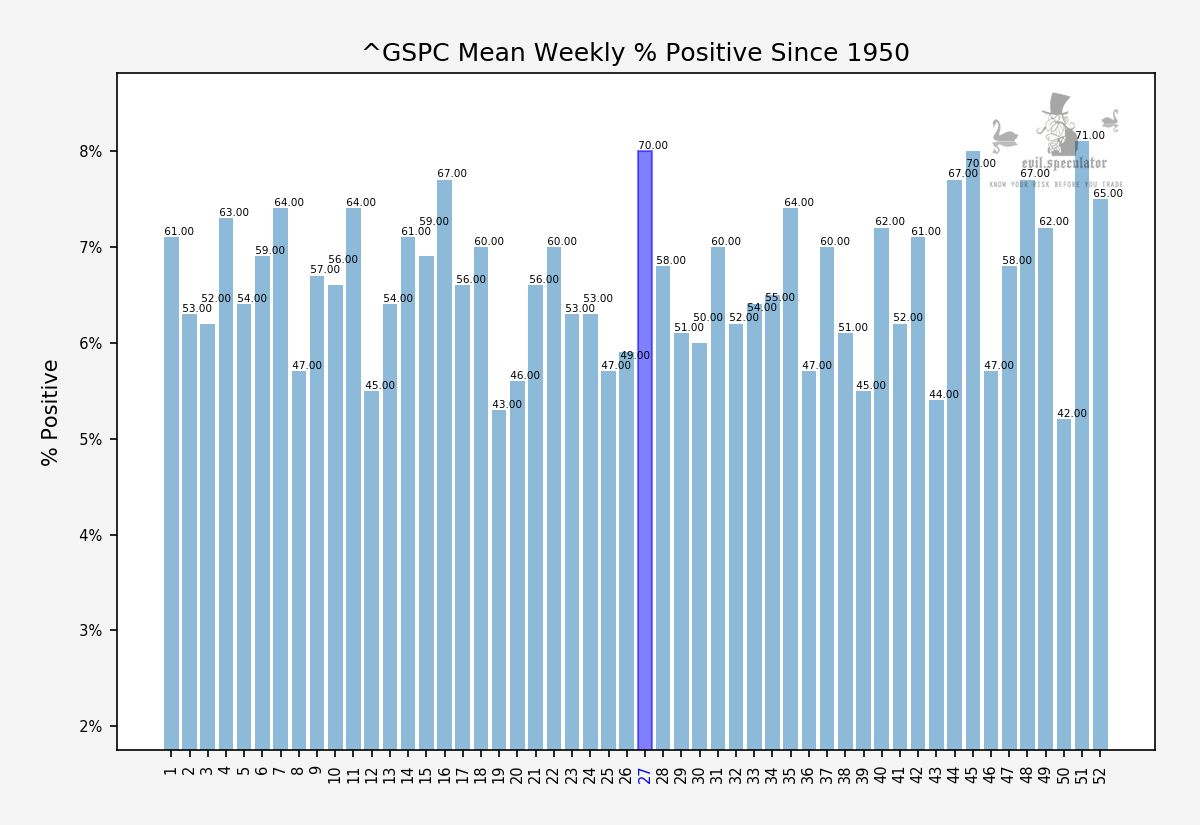
Talking about outliers. Some may think this may be due to a few large spikes that skew the data set. NOPE. Look at the percent positive graph which has it at 70% – the second highest of the entire year after the last week of December.
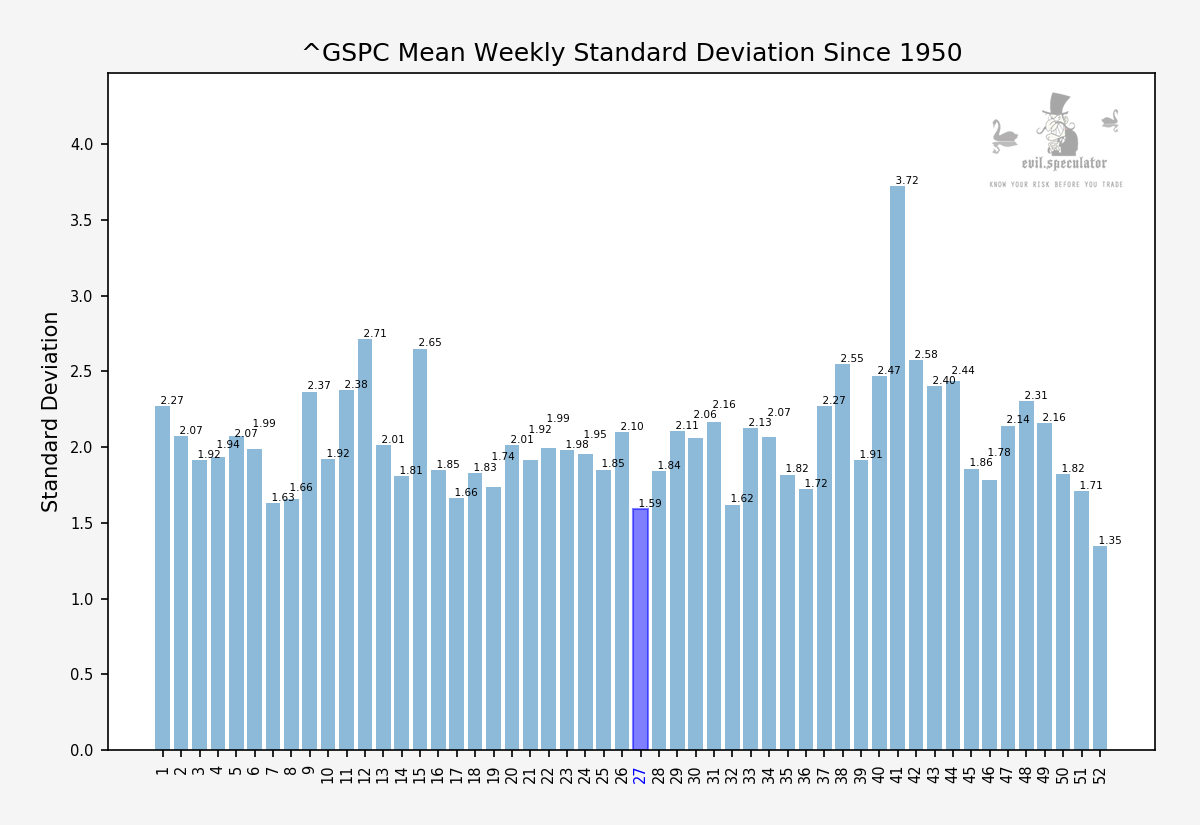
And to sweeten the deal standard deviation is extremely low at 1.59 – well below the median.
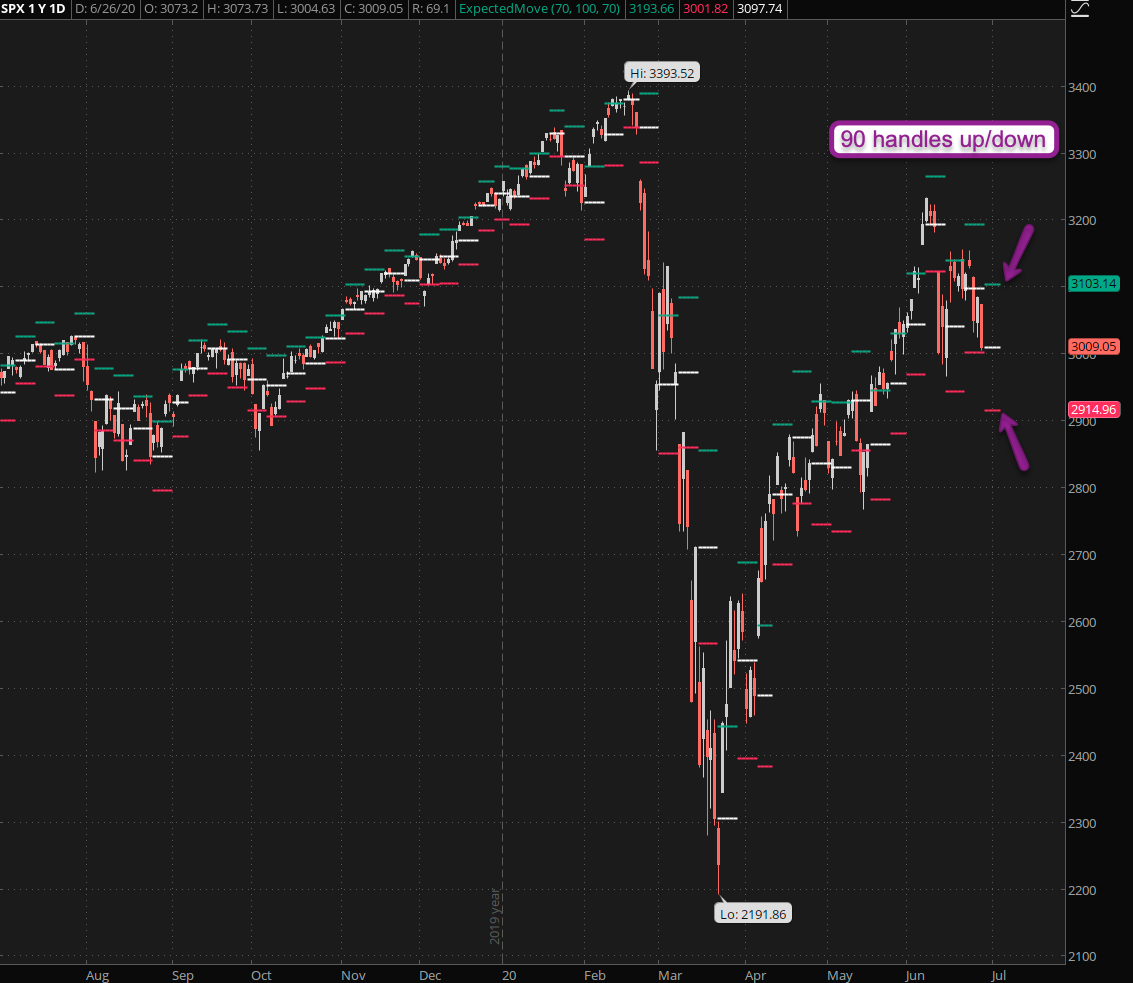
Of course almost nothing in 2020 thus far has been textbook and let’s remember that implied volatility remains highly elevated in lower bearish territory. The expected move (EM) for the week is around 90 handles – less than last week but clearly market participants expect a lot more than a 1.59 stdev.
[MM_Member_Decision membershipId='(2|3)’]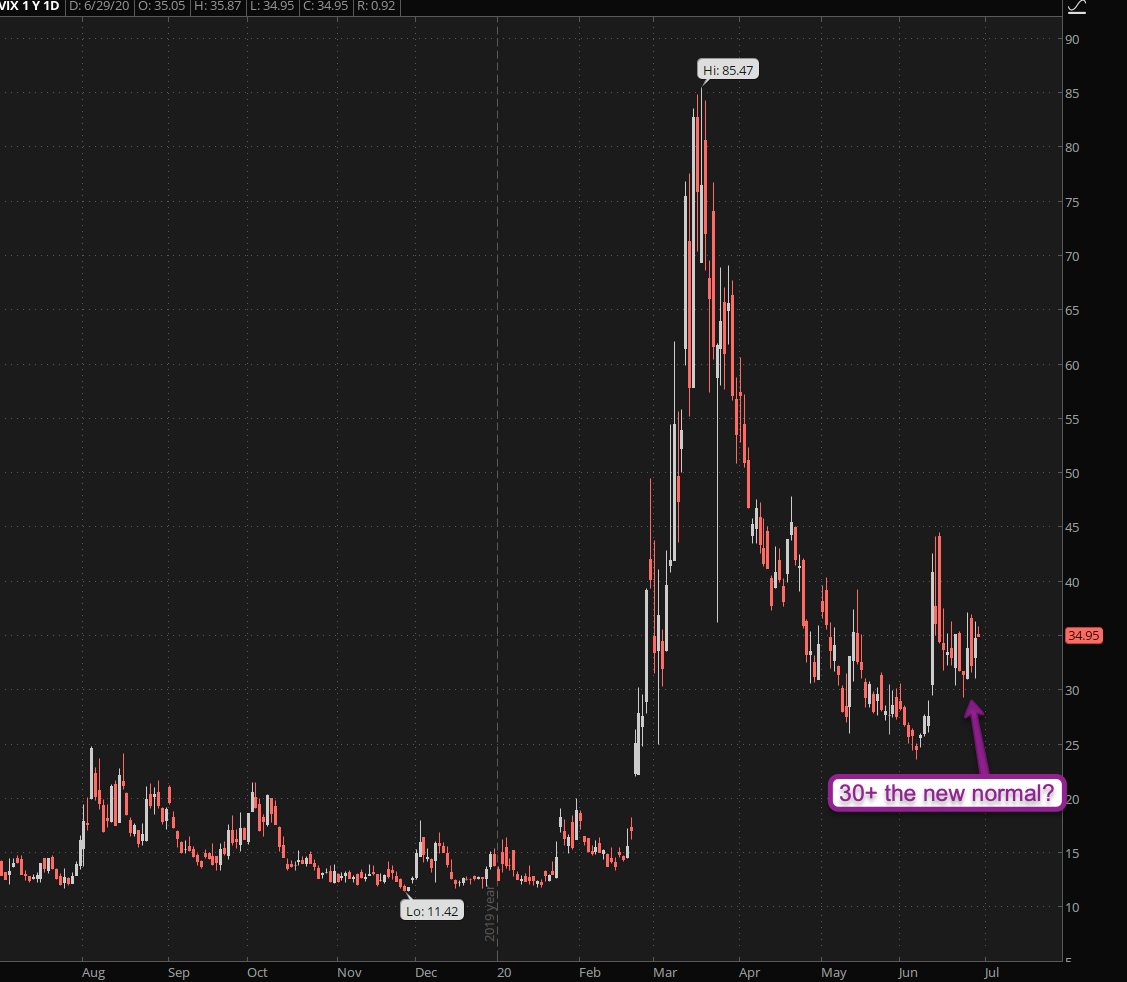
The VIX seems to be settling into a sideways range just above the 30 mark and this may be our new normal until after the presidential elections and probably longer.
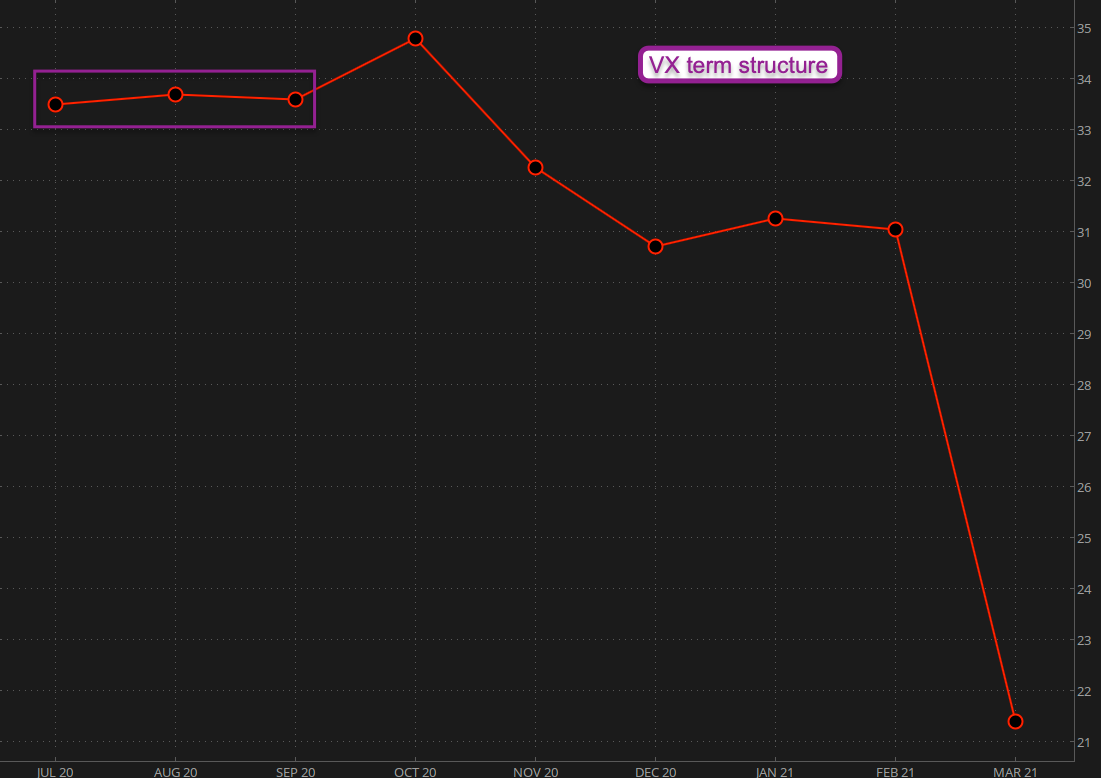
And this is not a temporary perspective. The VX futures’ term structure shows this rather nicely in that we’ve now got a completely flat plateau for the coming quarter and even after the October drama there doesn’t seem to be much anticipated relief until next year.
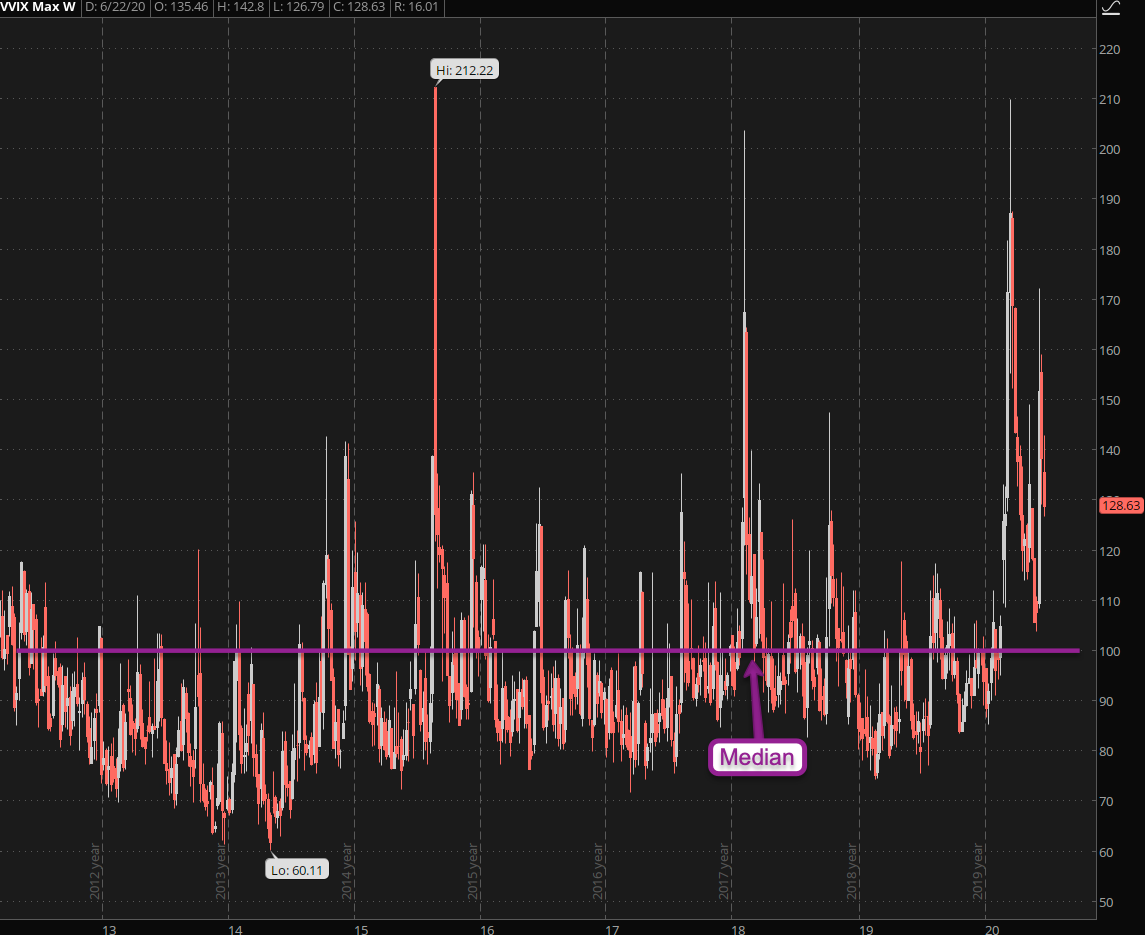
The long term VVIX chart goes back to 2013 also puts things into context. We are far above the median (thumb by pi – I didn’t run the actual number) which is a bit weird given that we are trading only 400 handles below all time highs.
But even if we saw a rally into 3400 I don’t think we would be seeing the VIX at 15 let alone 10 anytime soon. There’s just too much chaos and confusion these days and it has anchored itself into the mindset of market participants.
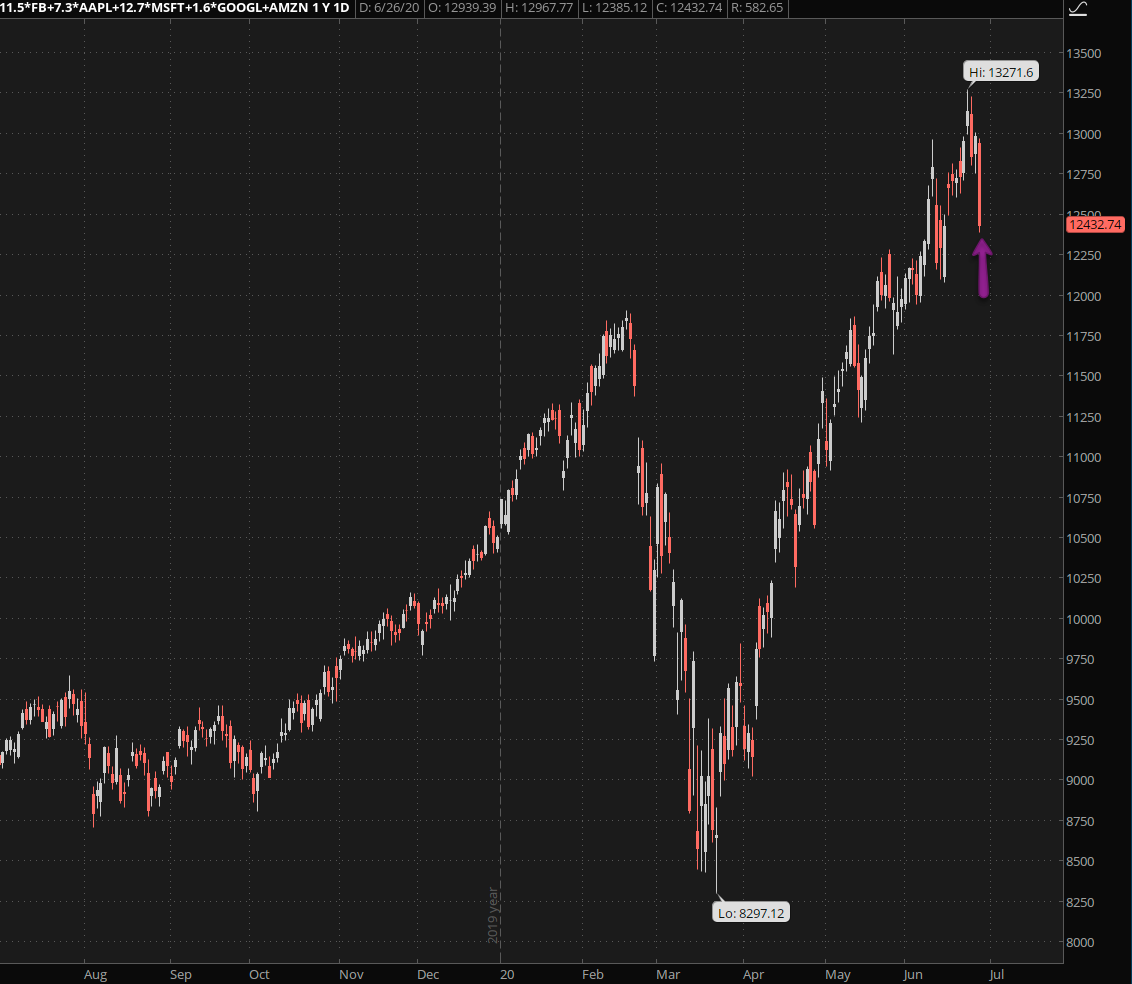
The monsters of tech composite got slapped down hard last week, which wasn’t overly surprising after such a face ripping rally higher. Many are expecting a fall from grace for FB in particular which is why I will be looking at possible signs of a long opportunity.

Remind yourself of the many times large giants like AAPL, MSFT, GOOG, FB, etc. fell out of favor for various reasons and inspired the bearish ire of analysts everywhere. Only to bounce right back and burn the all the shorts to a crisp. It may not happen this week or the next but it will happen.
Unless you’re already short and profitable pay no attention to all the noise and stick with your charts.
[/MM_Member_Decision] [MM_Member_Decision membershipId=’!(2|3)’] Please log into your RPQ membership in order to view the rest of this post. Not a member yet? Click here to learn more about how Red Pill Quants can help you advance your trading to the next level.[/MM_Member_Decision] [MM_Member_Decision isMember=’false’] Please log into your RPQ membership in order to view the rest of this post. Not a member yet? Click here to learn more about how Red Pill Quants can help you advance your trading to the next level.
[/MM_Member_Decision]


