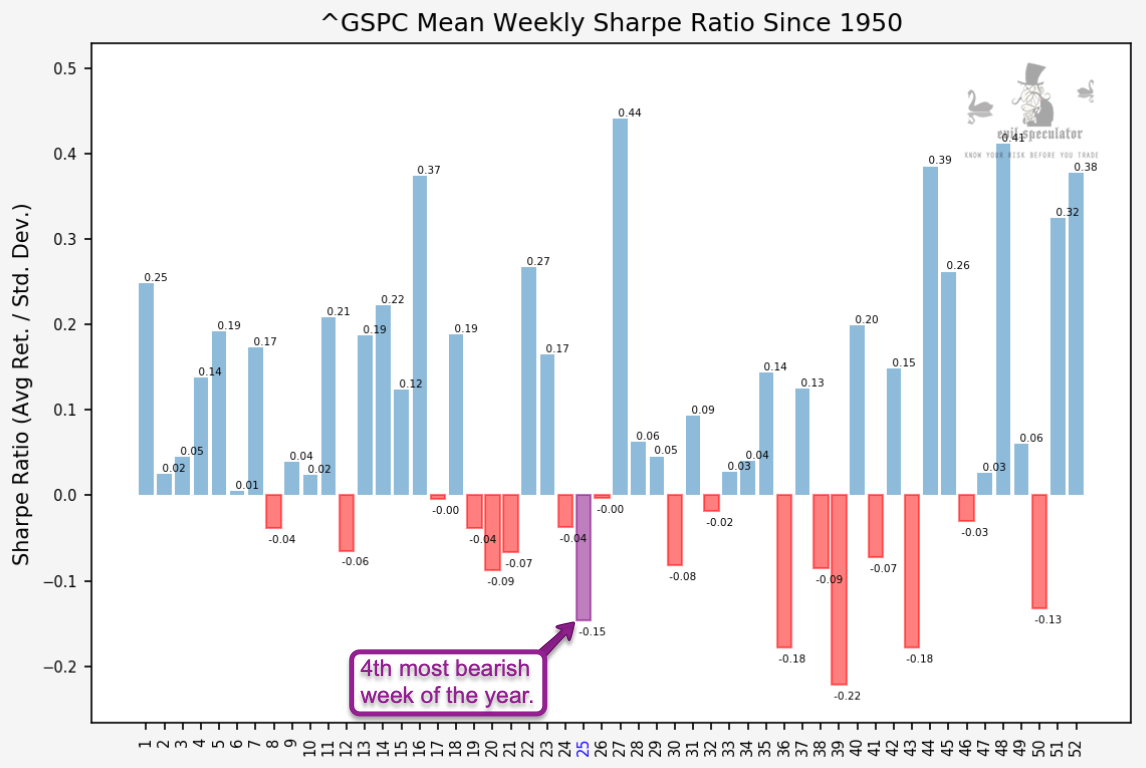
Welcome to the fourth most bearish week of the year, at least statistically speaking over the past 70 years. Seasonal bias has been touch and go over the past few years but it didn’t take a crystal ball to suspect that we’d be seeing some sort of correction during the onset of summer, and in particular after a record snap back rally that propelled us 1000 SPX handles in less than three months.
The weekly Sharpe ratio shows us us a yield of -0.15 which is only beat by a cluster of bearish weeks in September and October. If you recall the VX term structure is already accounting for a bout of volatility during that time.
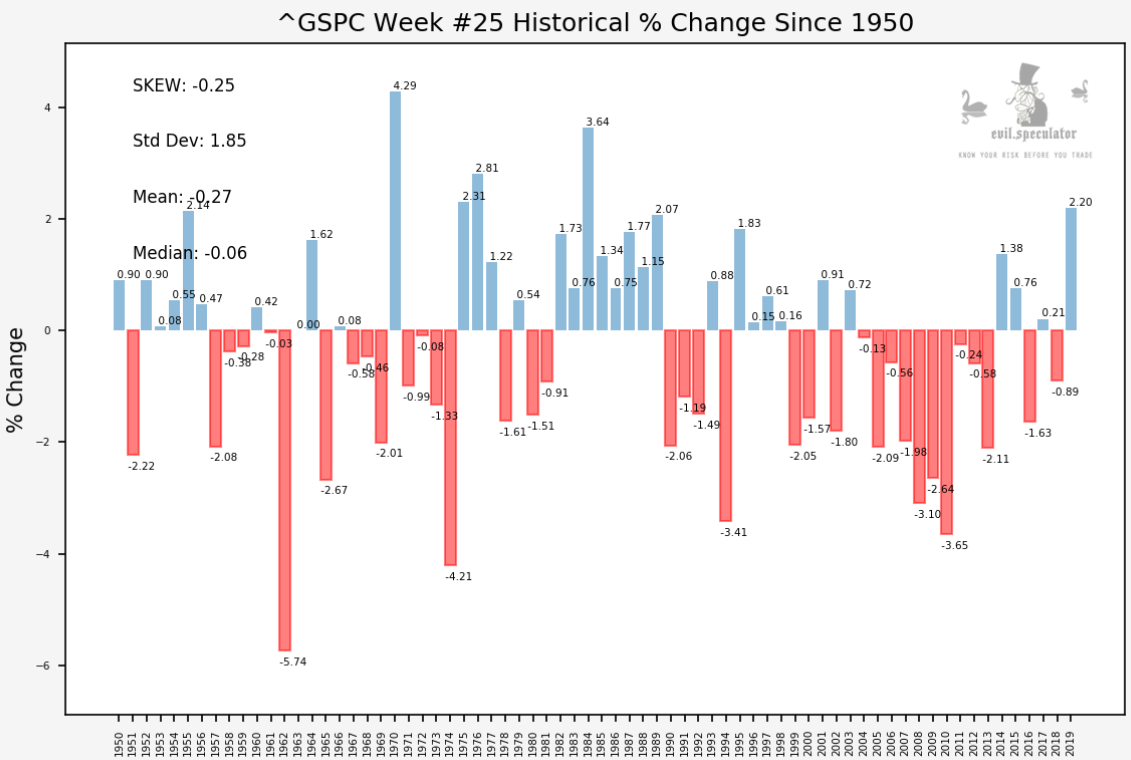
SPX historical percent change shows us the entire data set for week #25 plus a few stats in the top left. But it doesn’t take a degree in advanced statistics to figure out that we’re looking at seasonal headwind here.
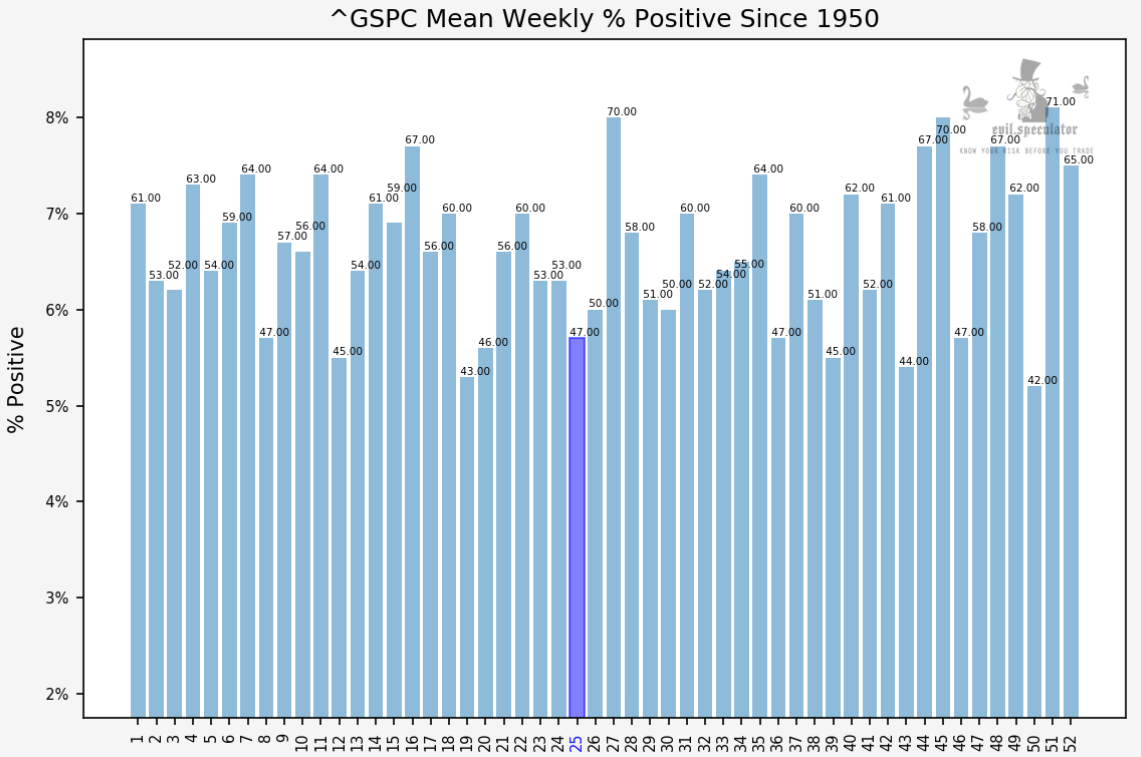
SPX weekly percent positive at 47% – that’s not the worst but when things get out of hand they usually slip significantly.
[MM_Member_Decision membershipId='(2|3)’]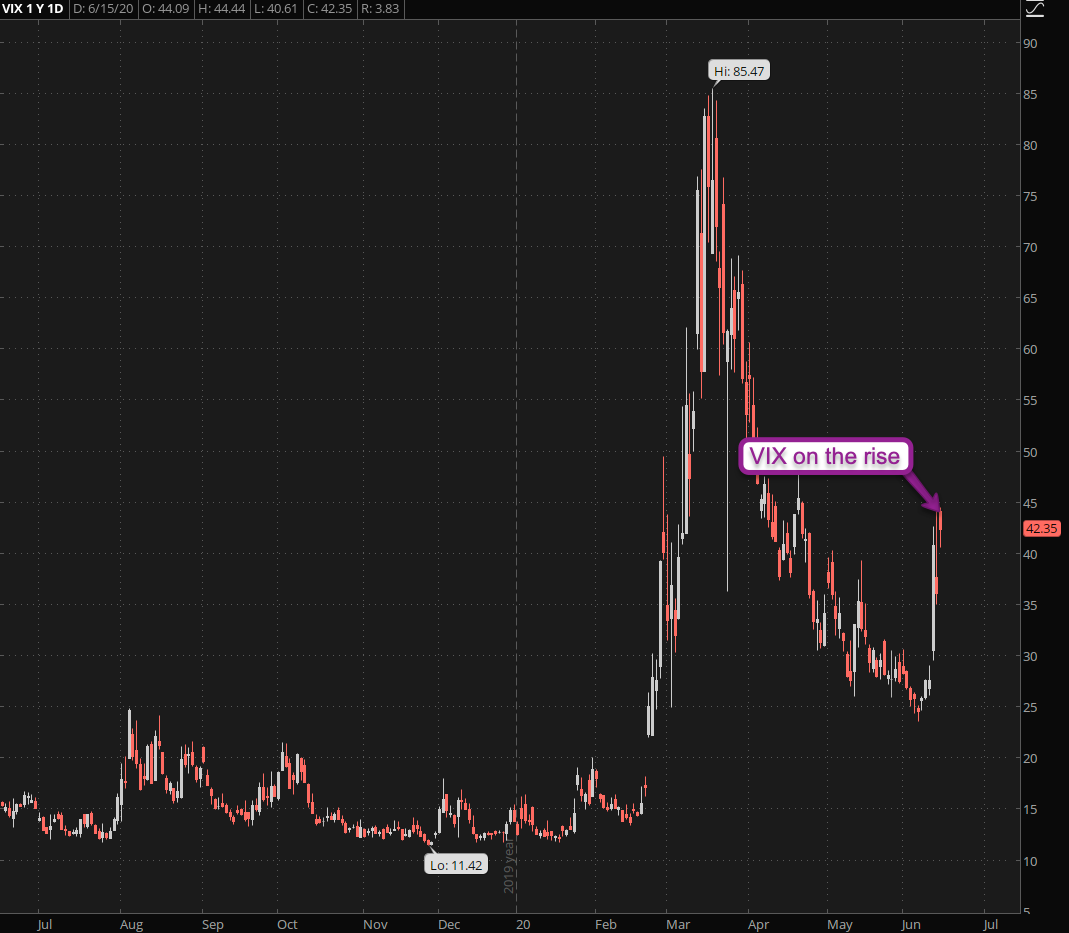
Not surprisingly the VIX is on the rise and may be pushing > the 45 mark this week. Again, not a big surprise there – I already mused several weeks ago that we’d most likely see another shock wave of IV reverberate through the market.
Things simply don’t die down with a whimper after a spike to > 85 mark. We had hopes of a quiet summer but alas – 2020 clearly ain’t the year for that it seems.
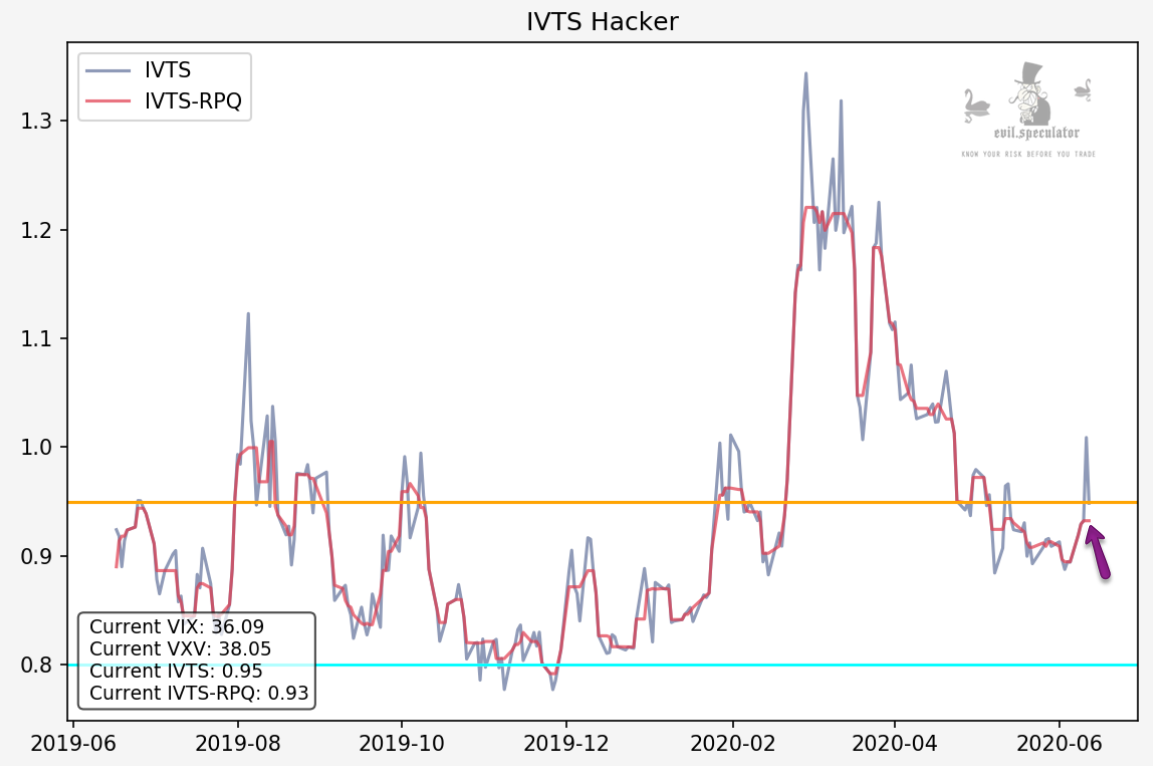
The implied volatility term structure looks a bit more positive, at least for today. We saw a push back > the median at 0.95 which then reverted a bit on Friday. Our smoothed IVTS control suggests some mean reversion, which we may get today. I’ll keep a close eye on the Zero after the open.
That however has little bearing on the remainder of the week. A push back > the median most likely puts us into a bearish pre-summer cycle. If you’re looking for bullish relief you may have to wait for the first week of July which, as I already mentioned most recently, (strangely) is the most bullish of the year.
Again, all statistically speaking – this should not be considered as chiseled in stone and guaranteed to happen. For an example of that look at this week a year ago (2nd chart), which was massively bullish.
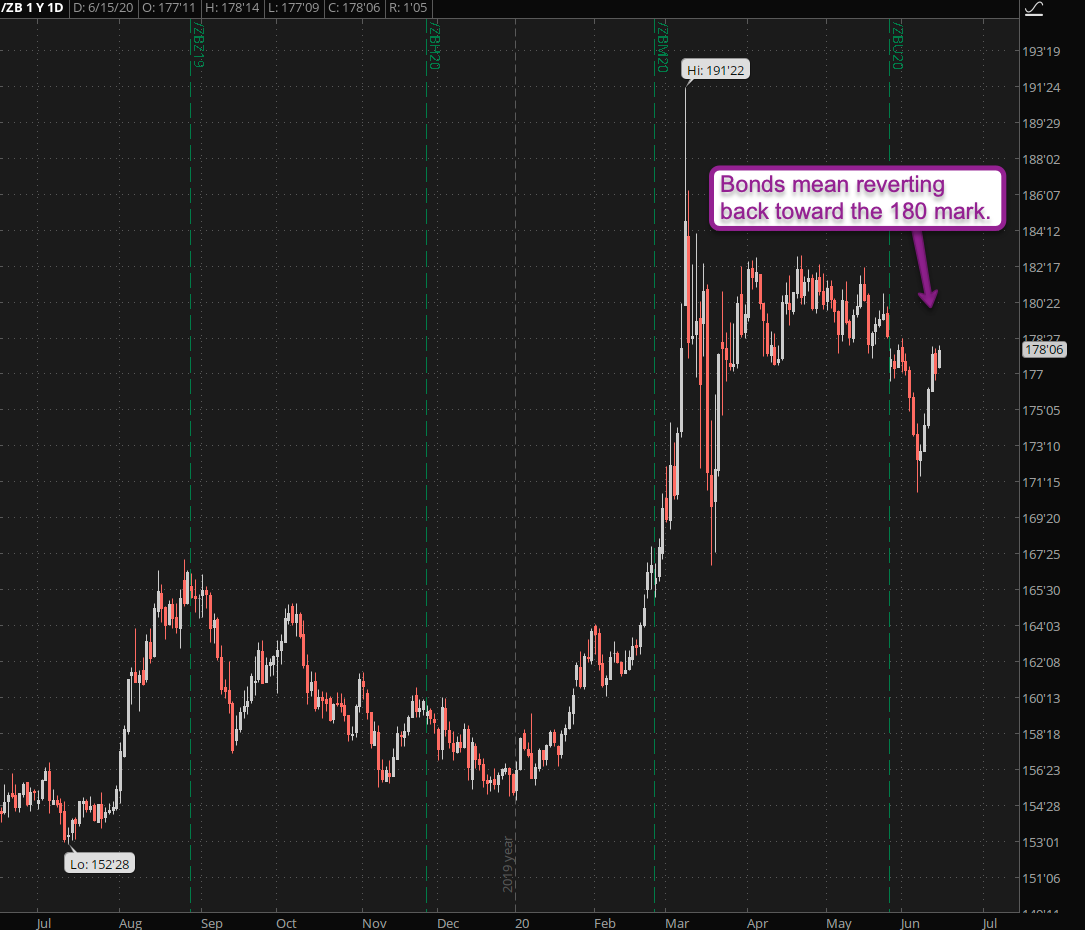
Bonds are back en vogue and the current formation suggests a reversion back to about 180 plus minus. If we indeed see more bearish tape in equities this week this should provide ample boost of course.
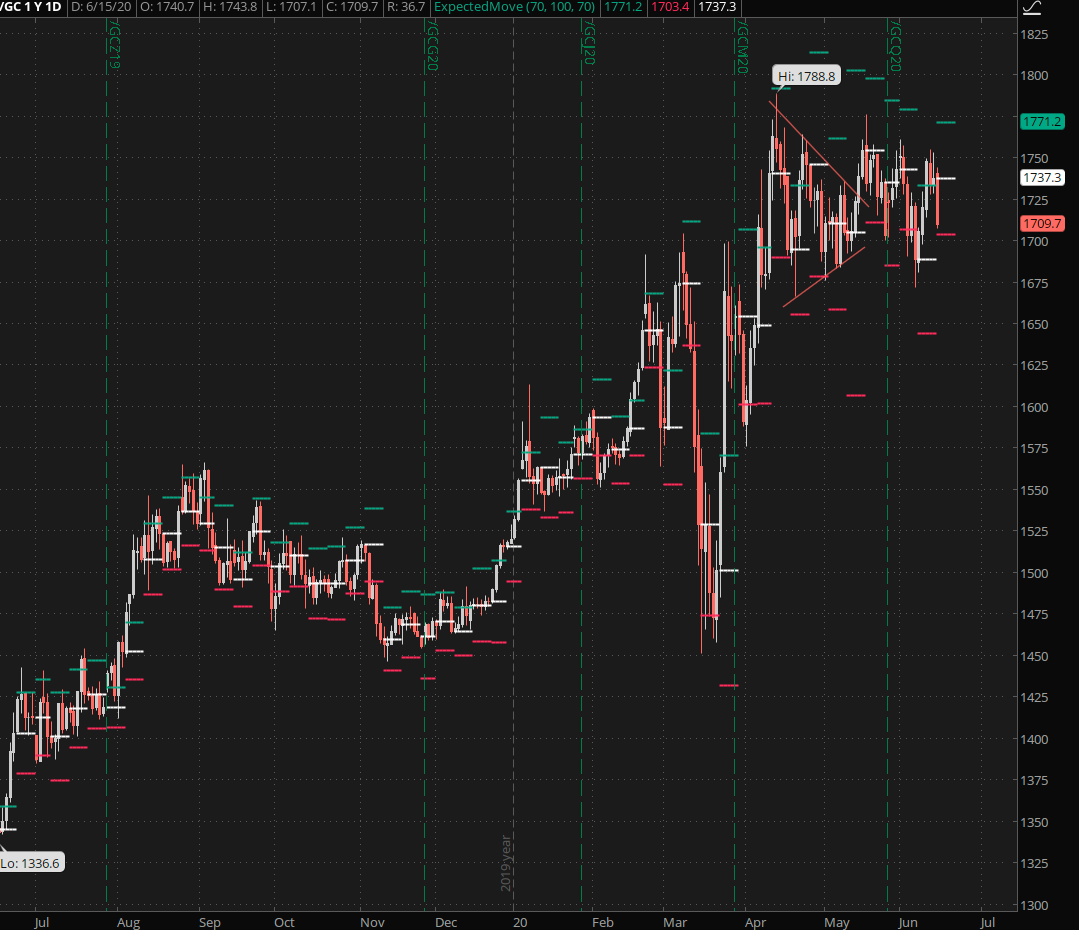
Public service announcement: Just stay out of gold right now – it’s in yet another sideways churn from hell with volatility to boot. If you’re a scalper or swing trader this may be your cup o’ tea but IMO there are easier fish to fry out there.
[/MM_Member_Decision] [MM_Member_Decision membershipId=’!(2|3)’] Please log into your RPQ membership in order to view the rest of this post. Not a member yet? Click here to learn more about how Red Pill Quants can help you advance your trading to the next level.[/MM_Member_Decision] [MM_Member_Decision isMember=’false’] Please log into your RPQ membership in order to view the rest of this post. Not a member yet? Click here to learn more about how Red Pill Quants can help you advance your trading to the next level.
[/MM_Member_Decision]


