Whether you admit it or not the market has us all trained like Pavlov’s dogs. Grab yourself a copy of Meditations (Marcus Aurelius) or The Prince (Niccolò Machiavelli) and one thing becomes painfully. Despite all our technological advances human nature in essence has not changed one bit. And believe me when I tell you that Ms. Market has a bonafide PhD in how to press our buttons, a.k.a. the scientific study of fuckwithretailology.
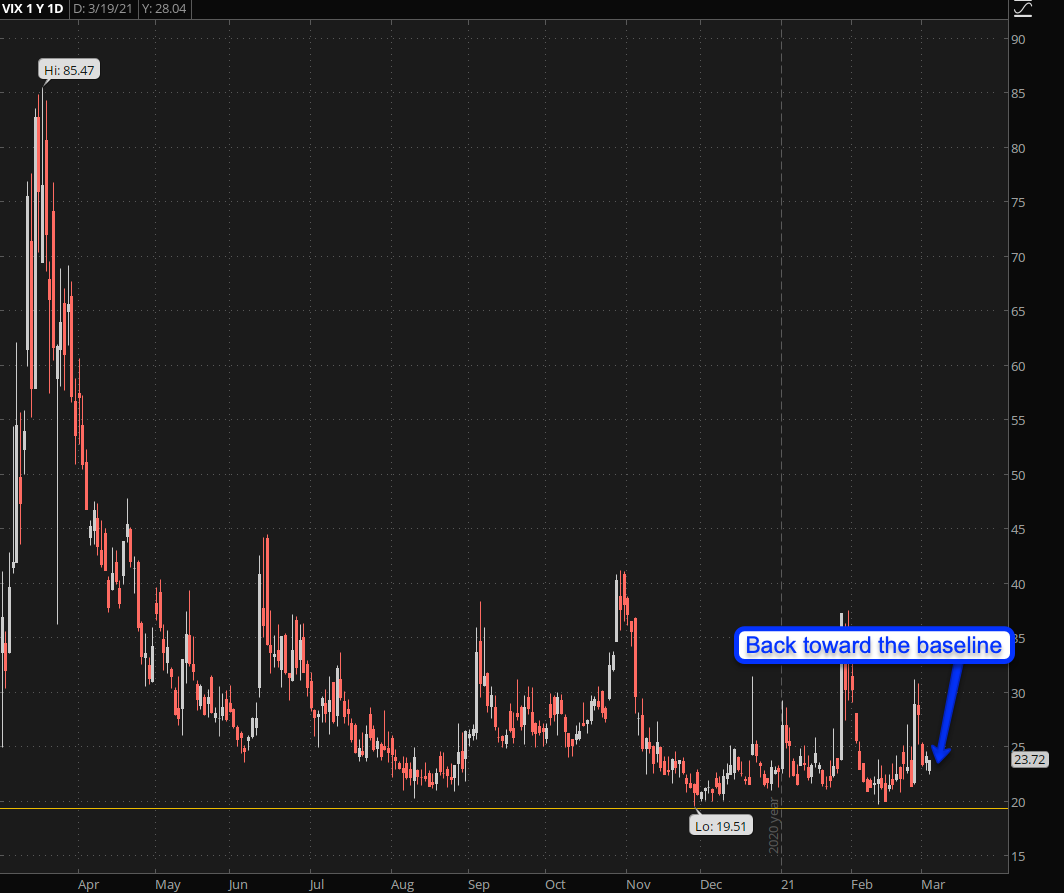
Which is easily demonstrated by simply glancing at a VIX chart. Have you ever pondered as to why the lower/bullish IV range goes from about 10 to the 20 mark? Medium IV only occupies about 10 handles, and once you get to 30 it either turns within a few handles or all hell breaks loose.
That’s called non-linear distribution in geek speak and offers us great insights into human psychology. Which alternates between utter complacency and bare naked fear in roughly a 4:1 ratio. Understanding this can be very useful from a trading perspective.
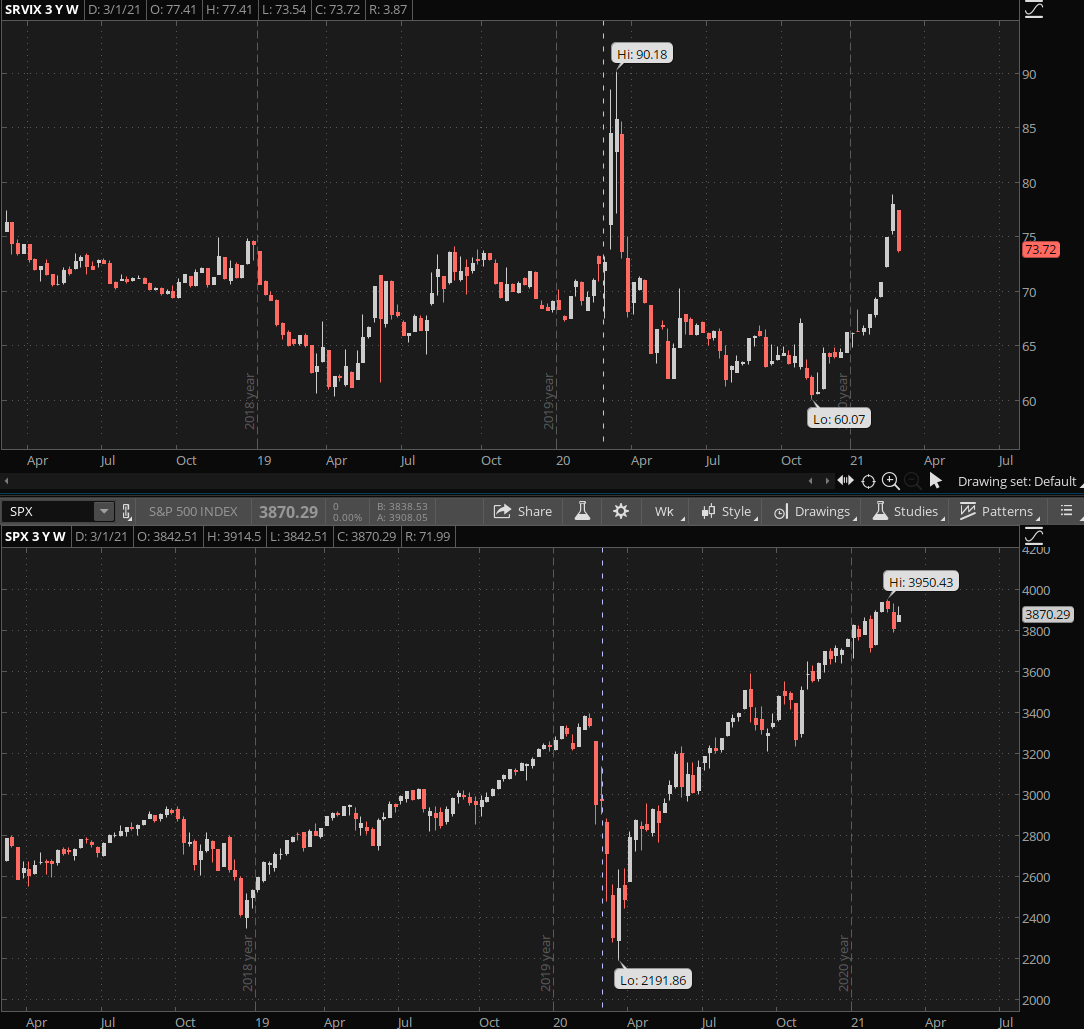
Let me introduce you to a new friend called the SRVIX. Yes, it’s clearly related to implied volatility but not in the way you may imagine. The symbol is actually an abbreviation for CBOE Interest Rate Swap Volatility Index and if the words ‘interest rate swap’ somehow rings a bell then you probably have heard of Michael Burry and his giant claim to fame CDS trade which eventually banked him and his whinging clients a veritable fortune.
So why would I look at this chart? Am I about to trade credit default swaps? Not really but I use it as canary in the coal mine of sorts in that large spikes and especially important inflection points give me deeper insights on how institutional traders perceive the market at any moment in time.
As you can see there was a large spike almost exactly a year ago and if you timed it properly you were able to ride the remaining sell off all the way to the bottom. Getting out was actually pretty easy as the signal recovered much quicker than any other volatility indicator. In other words: institutional traders know a lot of things you’ll never even hear about – unless you’re an implied volatility junkie like yours truly.
Now if you would have me guess the question in your mind right now then I’d point at: Has the crisis been averted or is this only the quiet before the storm?
To answer that please meet me down in the lair:
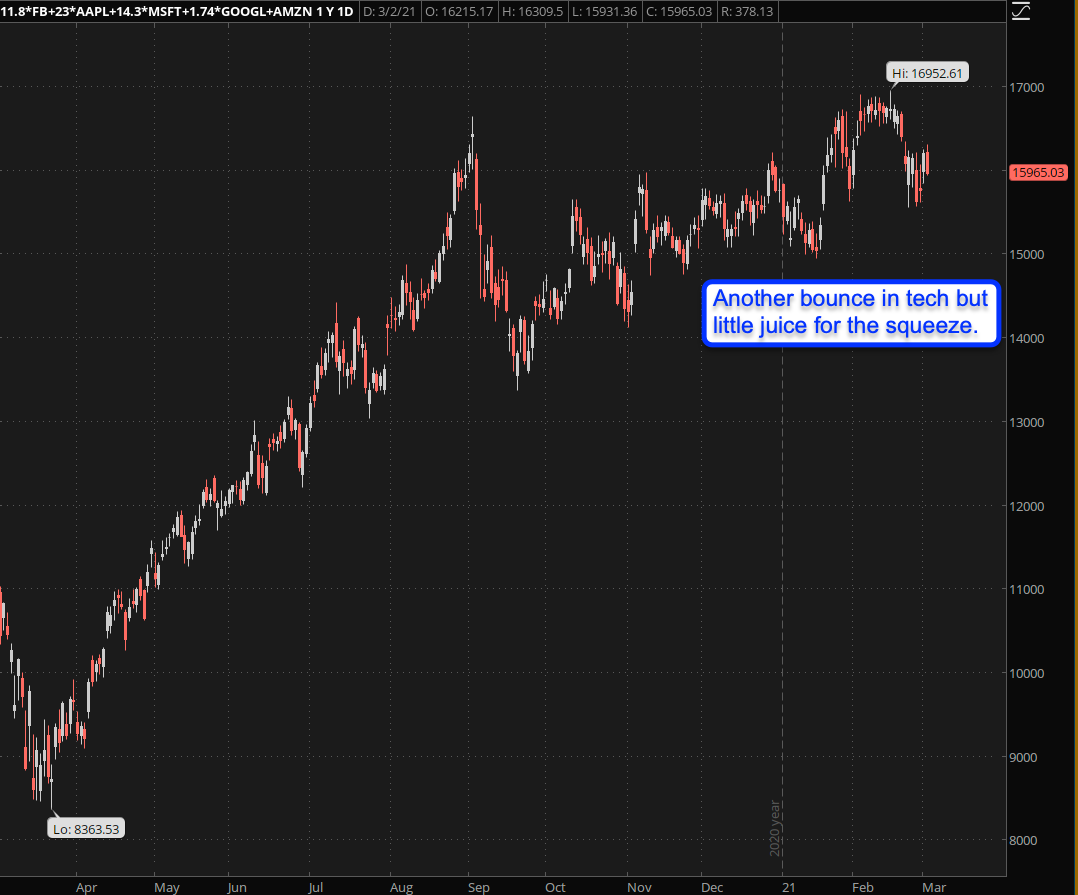
[MM_Member_Decision membershipId='(2|3)’] True to form I will present my pertinent thoughts in the form of charts. After all talk is cheap and evidence is usually scant, unless you are a subscriber here of course 😉Exhibit A – the monsters of tech index which is a subset of the NDX and tracks only the big boys: With record profits and being the last tech overlords standing I’m not seeing the love here. Yes this bounce can be played but a drop through the previous spike low may easily lead us much lower in a jiffy.
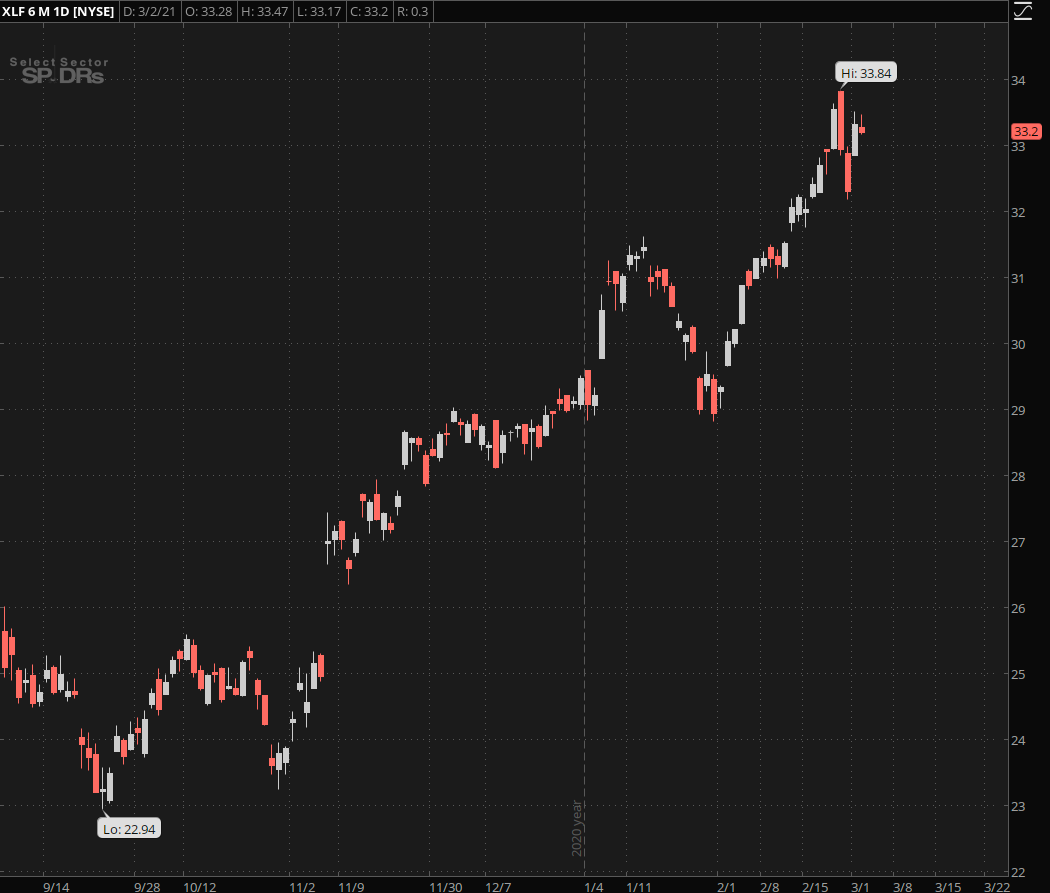
Exhibit B – the XLF – a.k.a. the only sector that has been maintaining the SPX over the past few months. It’s always good to be bank but it’s been particularly good since November of 2021. Ask yourself this however: what happens when that changes. E.g. when the TNX explodes higher and rising interest rates start to affect financials in a negative way?
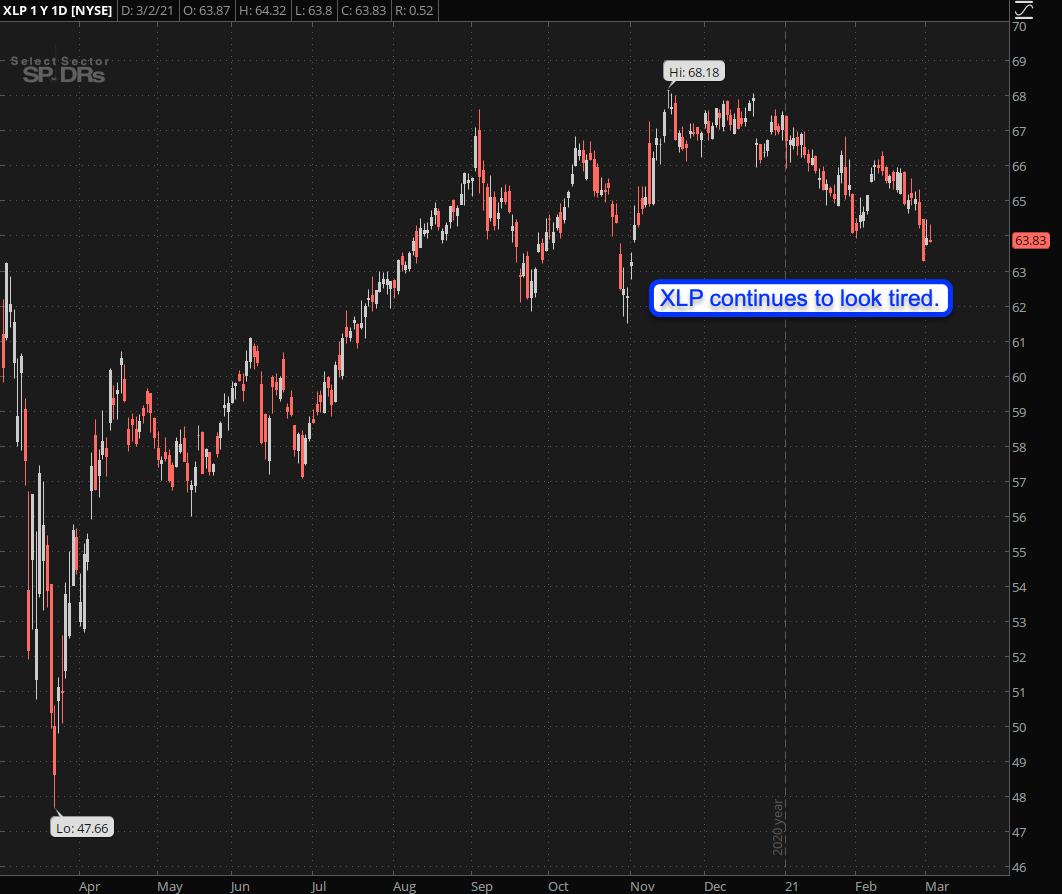
Exhibit C – the XLP, which is looking very tired. To be honest consumer staples should not be dropping during an epidemic and although there are signs of normalization with Texas and Mississippi leading the charge the current trend has been sideways since las summer.
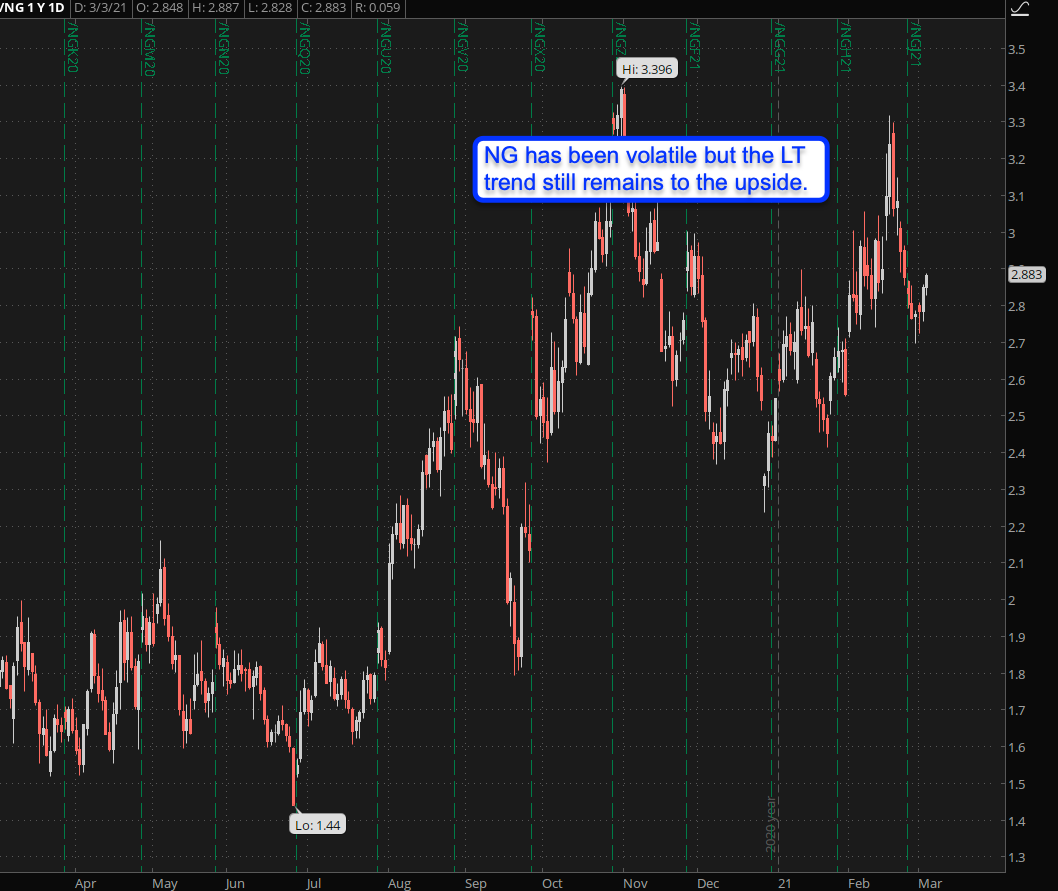
Exhibit D – natgas, which doesn’t look super bullish but it is pushing higher and at this point 2.8 looks like a good dip buying opportunity.
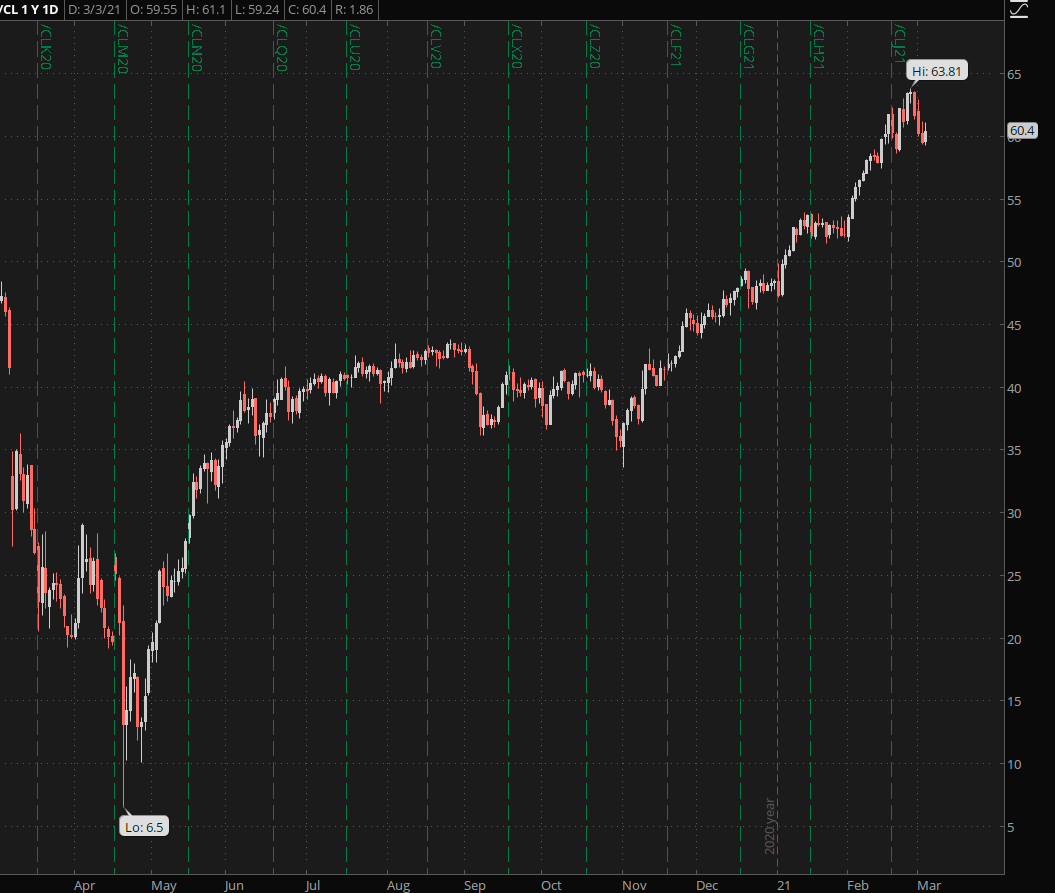
Exhibit E – crude. What can I say? Talking about going from 0 to 60 – in this case it took a year but let’s remember that crude futures were trading in NEGATIVE territory last spring. Again, note the spike higher starting in November of last year, which obviously does not require explanation.
Don’t get impatient, I’m going somewhere with this.
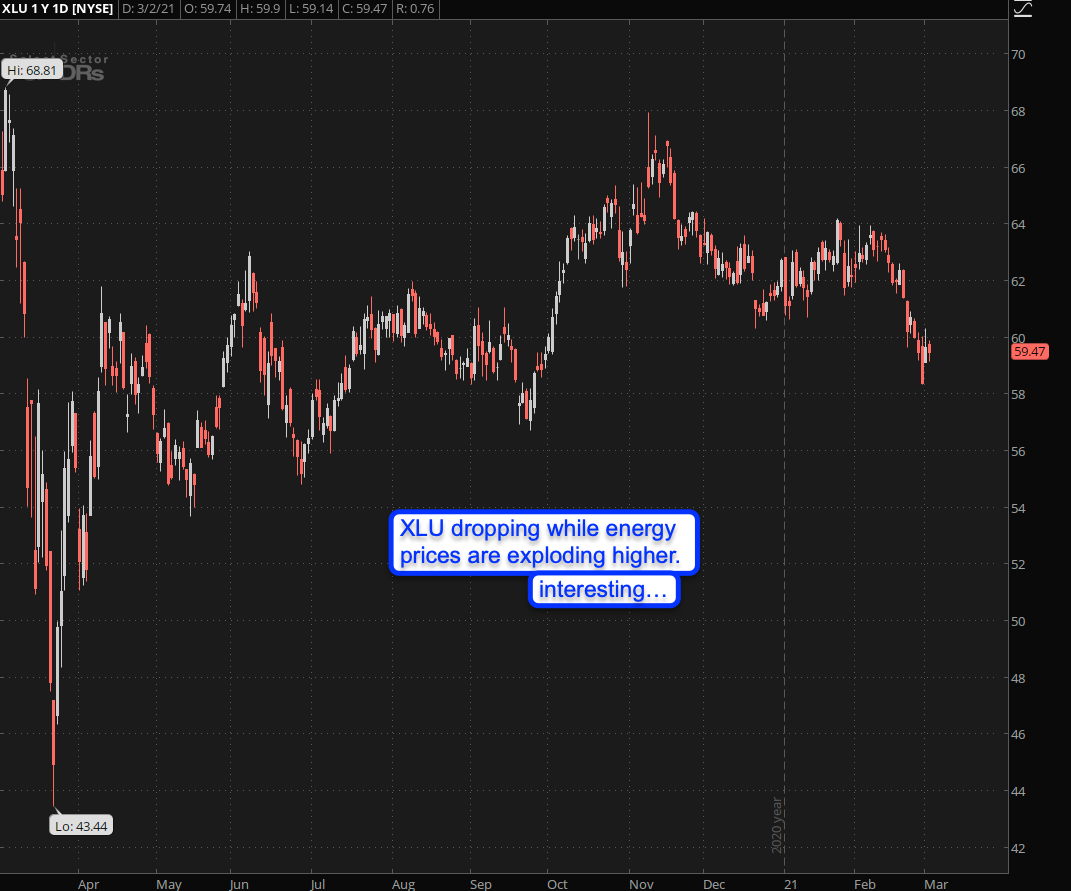
Exhibit F – the XLU – which is where I make my point: Can you explain to me why the XLU is clearly dropping while energy prices are exploding higher? I really cannot but obviously demand isn’t there and much of the squeeze we’ve seen in the energy futures relates to the UDS.
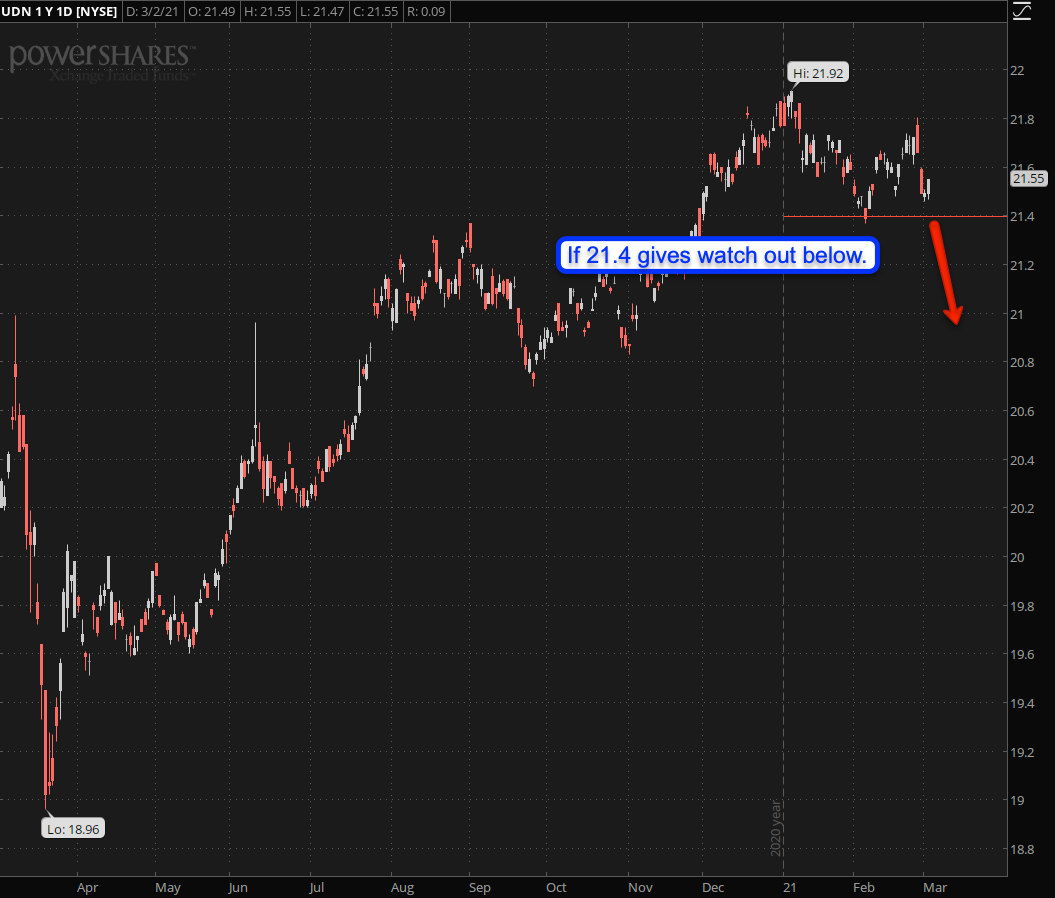
Speaking of which, here is exhibit G – the Dollar shown inversely via the bearish UDN: That looks like a possible – not guaranteed – but possible intermediate top to me. We’ll know this is not the case if it pushes above 22 but until then the risk of a drop < 21.4 remains and there’s nothing but air below.
The fact that the Dollar is stubbornly holding strong despite a $1.7 TRILLION bailout bill is quite stunning and also a bit scary to be honest, despite me benefitting from the relief in exchange rate.
Why? Because no matter what you’ve heard, the USD as of right now remains to be the reserve currency of the world. And when investors start to go into cash on a rising market, in the presence of a MASSIVE bailout bill, well …. it’s not looking good, innit?
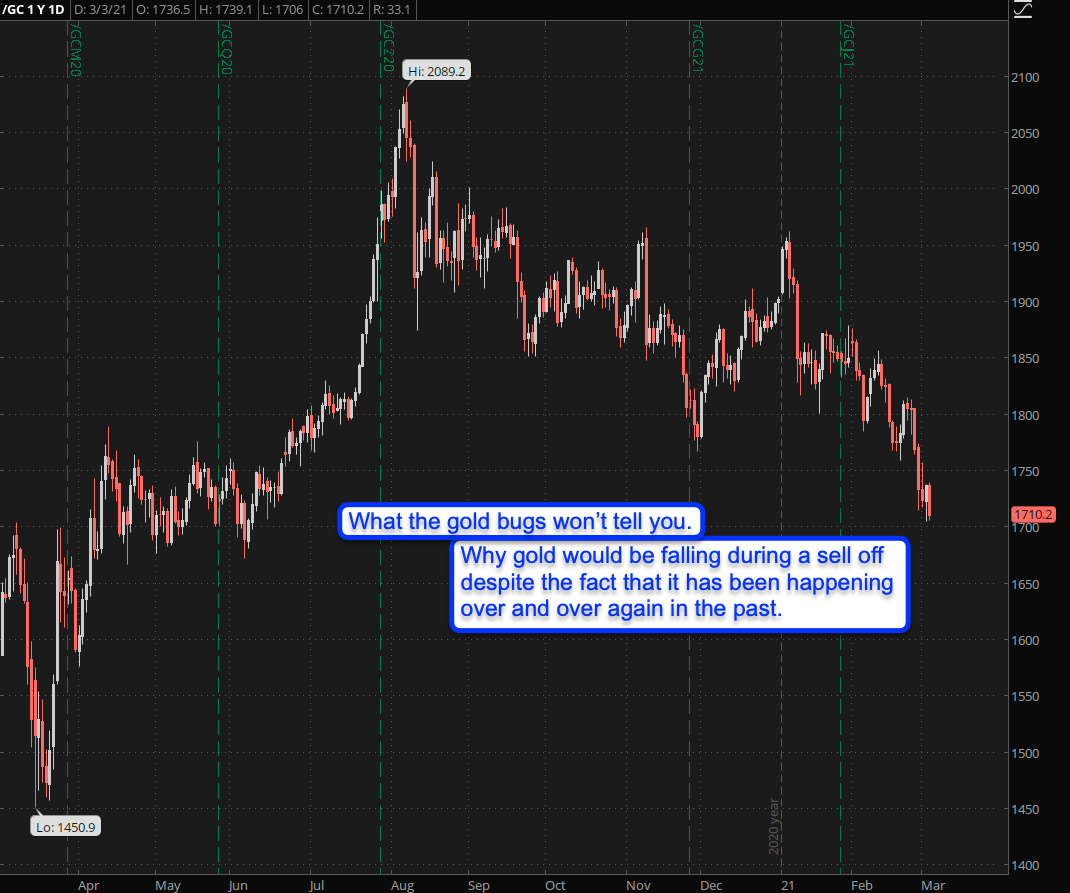
Last but not least exhibit H – gold: A lot of people, gold bugs in particular, remain terribly confused about gold. I’ve always fared pretty well calling the swings (when there WERE swings) for one reason and one reason only: I don’t care about shiny metal because I can’t eat it and I’ve never bought a sandwich with it.
Silver, okay – I can see that happening. But until that changes gold is just a precious metal that may occupy a small amount of my assets but it’s not going to play a major role. Especially given the fact that it has barely moved over the past few years while BTC has grown 100-fold since 2014. I still remember buying my first BTC at $440 from my buddy Scott.
What most of the goldbugs won’t tell you is that it’s quite normal to see gold fall along with equities for one reason: It’s being sold by large institutional traders during times of crisis. So if you think that gold ALWAYS explodes higher when the market tanks then you are simply and absolutely wrong.
Yes it may happen but depending on the holdings and the mood of the market it may fall. Probably less than equities during a crash and admittedly that’s better than a kick in the shin. So from a LT investment perspective I concur but short term don’t look at gold as a water tight hedge (linguistic pun intended).
Bonus Chart:
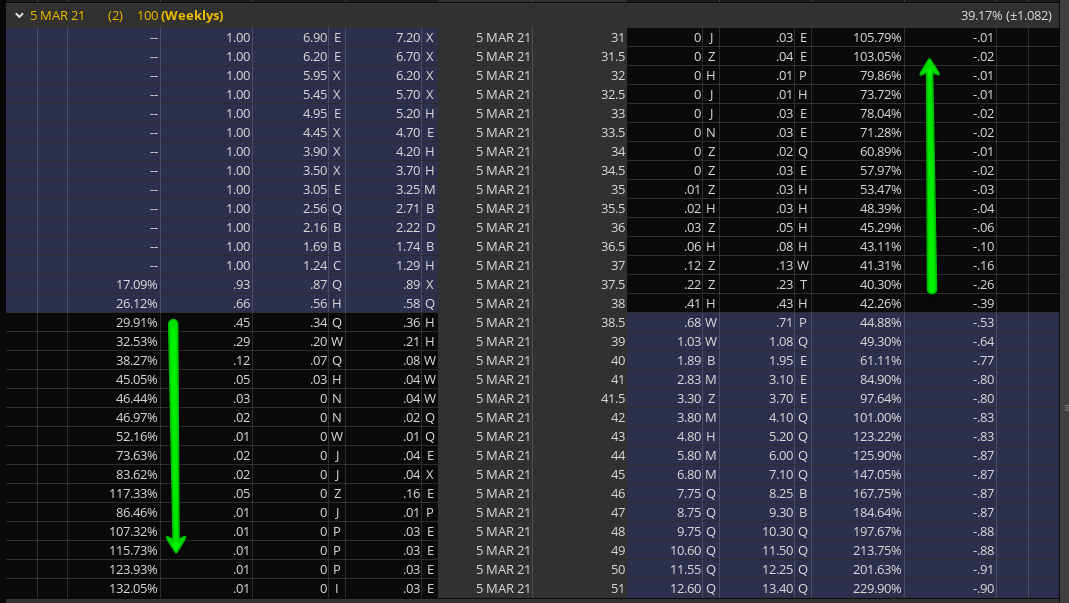
If you have paid any attention to my excerpts on trading options and SKEW then this WFC chain should make your jaw drop. Not that there is any liquidity present anyway – which is surprising, how could anyone pass on snapping up such deals? 😉
Bottom Line:
I guess you can probably guess my general outlook at this point. It’s very much possible that we’ll see a nice juicy ramp higher but I’m not going to be the one out there buying calls or selling OTM puts. Instead I’ve been loading up on downside positions whilst selling some far OTM calls courtesy of the significant SKEW that continues to prevail across longer dated option contracts.
[/MM_Member_Decision] [MM_Member_Decision membershipId=’!(2|3)’] Please log into your RPQ membership in order to view the rest of this post. Not a member yet? Click here to learn more about how Red Pill Quants can help you advance your trading to the next level.[/MM_Member_Decision] [MM_Member_Decision isMember=’false’] Please log into your RPQ membership in order to view the rest of this post. Not a member yet? Click here to learn more about how Red Pill Quants can help you advance your trading to the next level.
[/MM_Member_Decision]


