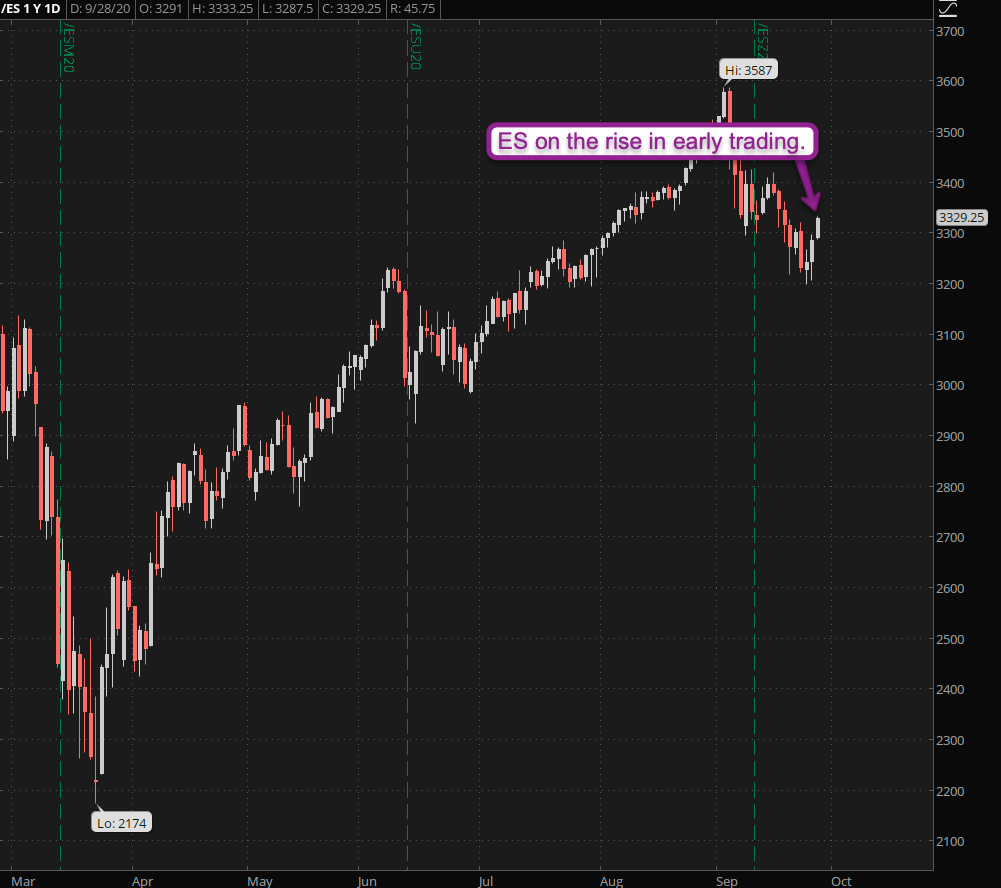
Last Friday I warned my subs to not yield to the bearish exuberance peddled across the financial MSM and to instead consider exploratory positions in select tech related symbols. Like the rest of you I don’t have a crystal ball. But what I do have is access to over half a century of statistical data which strongly suggested that week #40 had good odds for a short squeeze. At least judging by the overnight session a first attempt to bang the open into a gap appears to be in the works.
Unless we see an immediate pullback in the next hour the SPX should open around the 3340 mark (fair value of the ES currently being around -11). That’s over 40 handles off the Friday close and is guaranteed to rattle a few cages.
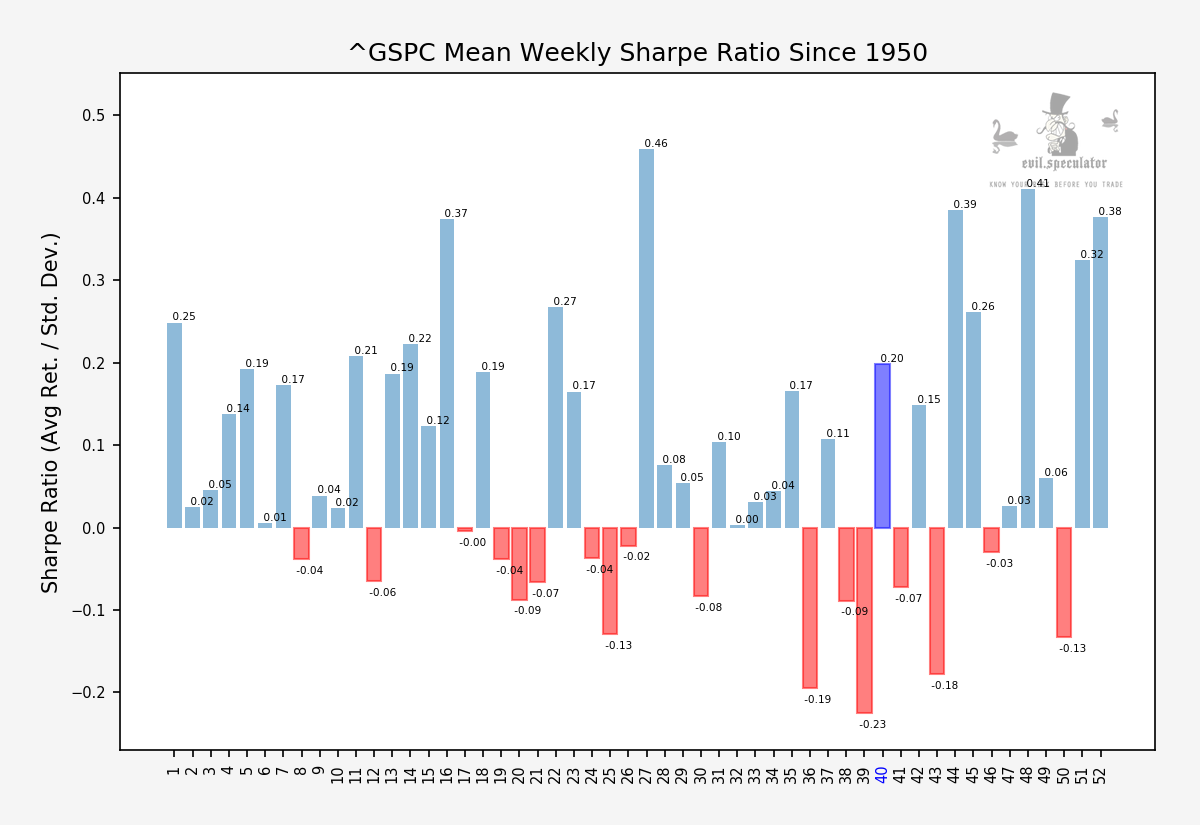
Monday is stats day, so let’s dive right in starting with the weekly Sharpe ratio. Which stands at 0.20 for week #40, comfortably above the median for the year.
We are far from being out of the woods with two more negative weeks ahead of us until we hit the traditional Santa rally season. Of course this being 2020 in combination with the U.S. presidential elections anything can happen between now and Nov. 3rd.
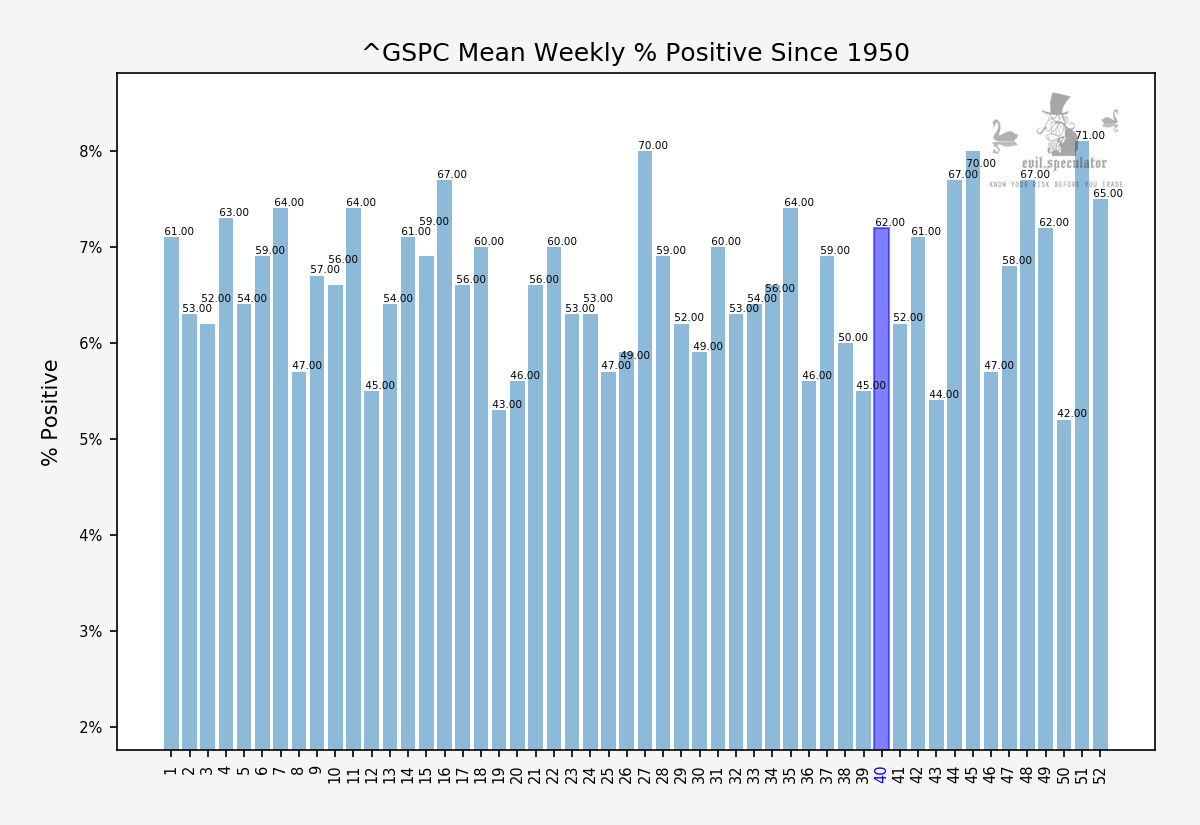
Percent positive is at 62% and you know what I’m going to say about that. Exactly, I’d take those odds any day.
More statistical goodness below the fold for my intrepid subs:
[MM_Member_Decision membershipId='(2|3)’]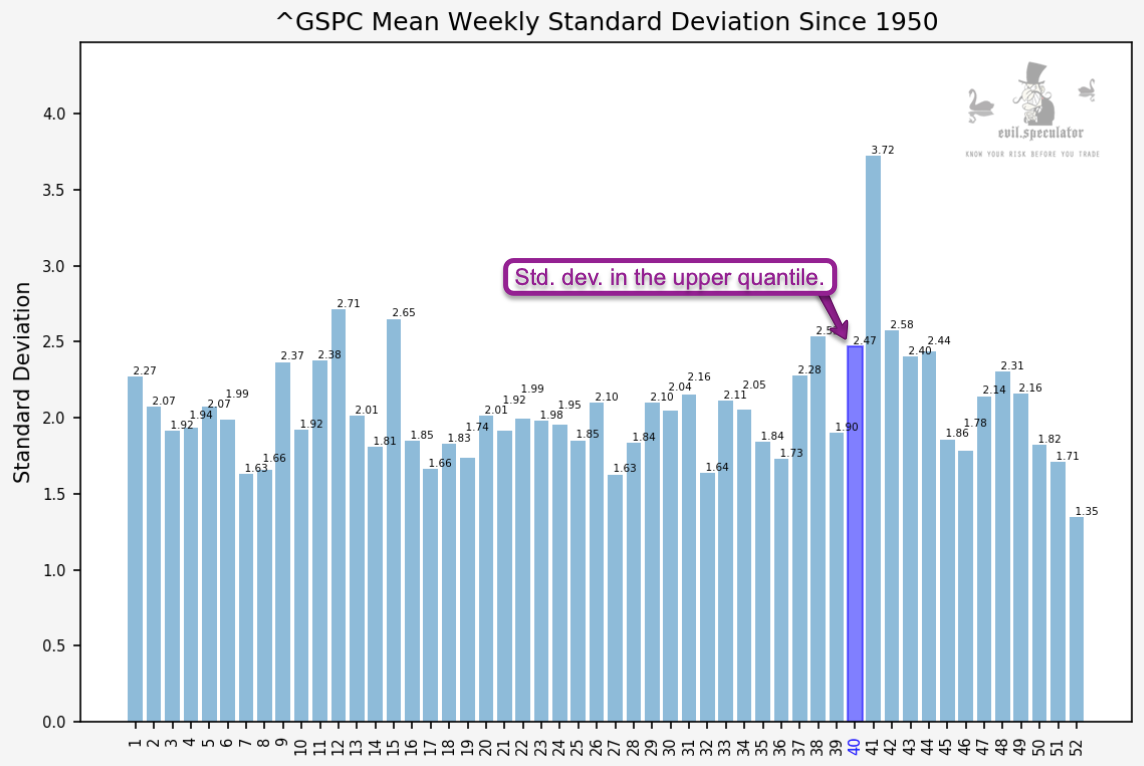
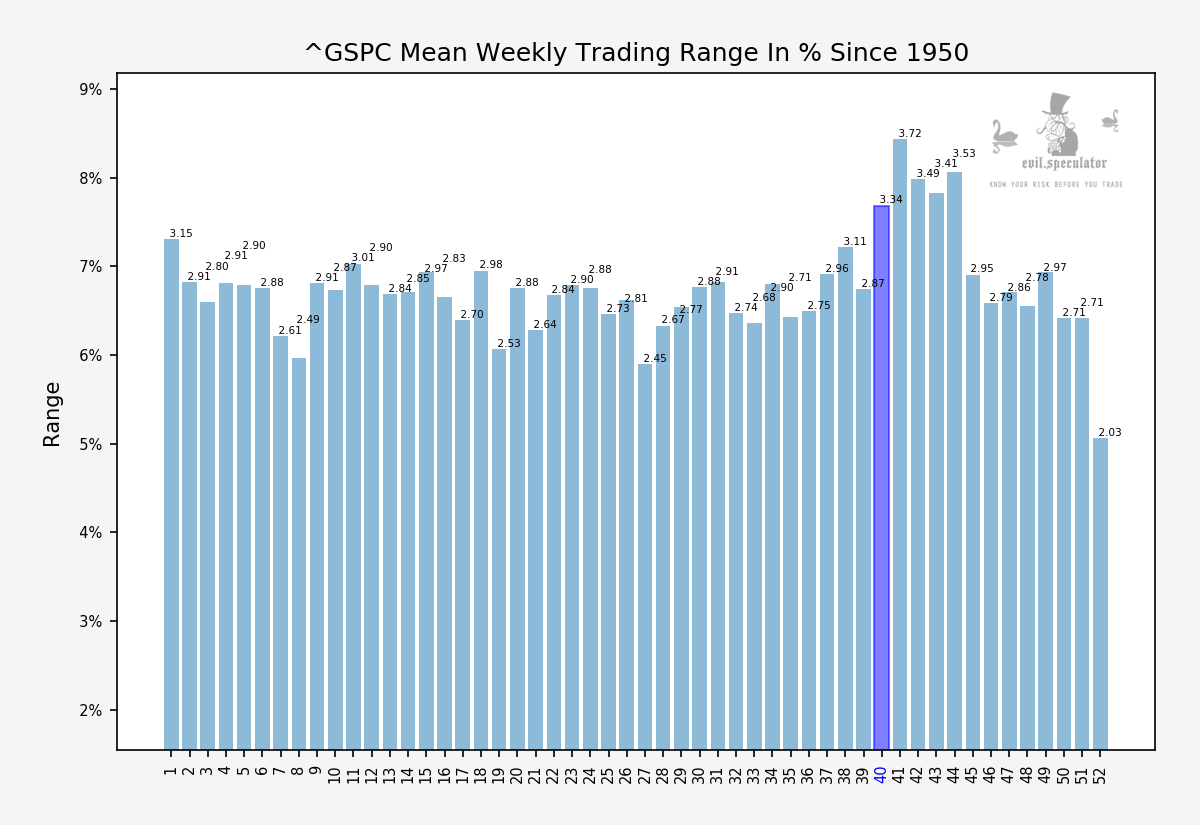
If you are trading with stops I however advice caution as standard deviation is expected to be high for this week at 2.47. Standard deviation refers to the amount of variation or dispersion within a dataset.
On its own not an issue however, something we may see for example is a big ramp higher followed by small range for several days (a.k.a. ramp and camp).
Here’s the weekly trading range which ranks in the top 5 of the year. This suggests that we have the potential for big moves this week. So expect a lot of twists and turns on the way to whoever we’ll end up on Friday.
I’d say hopefully to the upside but blog traffic explodes every time the market tanks. Retail loves bear markets 😉
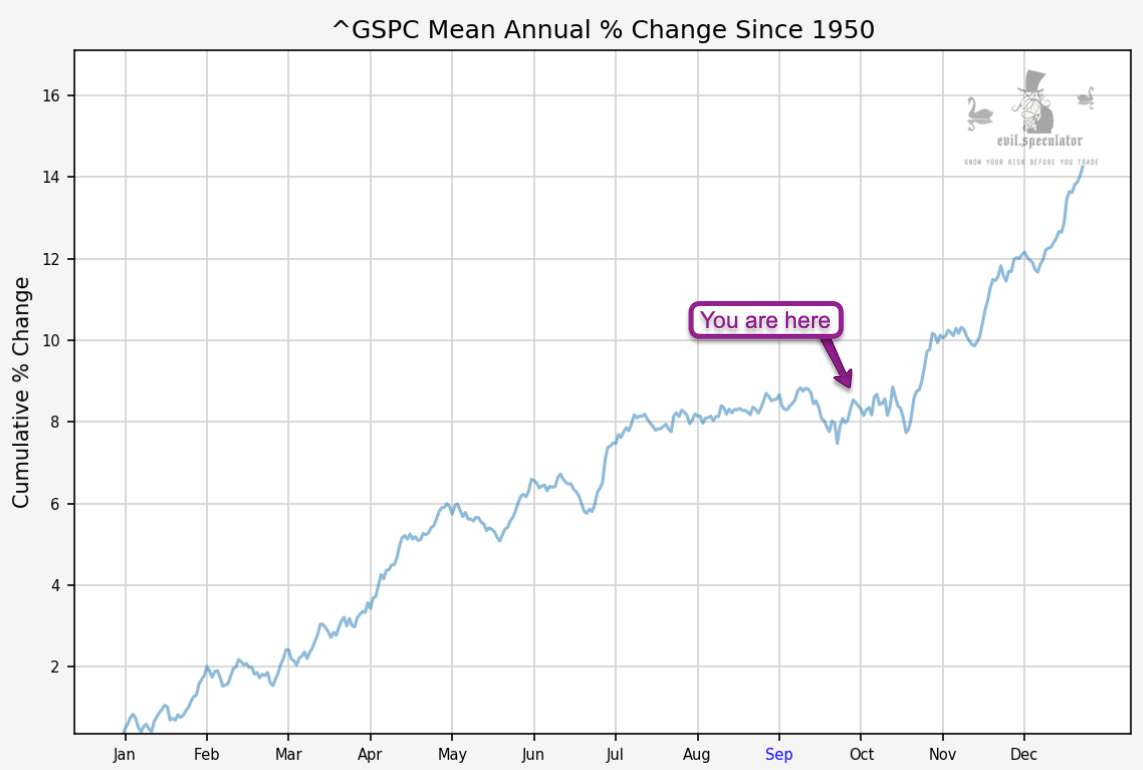
In regards to the overall map this is where we are for the year if you average out the past 70 years of trading history. October can still drag us lower but once we hit October 15th we are usually in the clear. Except that it’s an election year and I have an inkling we’re going to see fireworks all the way into mid November.
[/MM_Member_Decision] [MM_Member_Decision membershipId=’!(2|3)’] Please log into your RPQ membership in order to view the rest of this post. Not a member yet? Click here to learn more about how Red Pill Quants can help you advance your trading to the next level.[/MM_Member_Decision] [MM_Member_Decision isMember=’false’] Please log into your RPQ membership in order to view the rest of this post. Not a member yet? Click here to learn more about how Red Pill Quants can help you advance your trading to the next level.
[/MM_Member_Decision]


