An old friend wrote me over the weekend asking whether or not it was finally time to back up the truck and short the heck out of this market. My response to him basically boiled down to ‘never step in front of a speeding freight train’ – however true to form I did provide him with a few valuable pointers. Which I thought may actually make for a good post, so if you happen to currently suffer form bearish inclinations I suggest you put down your mobile enslavement gadget and pay attention.
The first thing to keep in mind, especially when it comes to the anticipation of outlier moves to the downside, is that they happen very rarely. If you’ve watched my Price Action Masterclass then you may recall this fistful of sobering statistics:
- Markets move 87% of price in only 11% of the time, that is both combined to the up side and the down side.
- Within that 87 percentile markets either go UP or push SIDEWAYS 80% to 90% of the time.
- This means rising or range bound markets represent the most common environment that traders will see throughout their trading career.
- Downside corrections only represent ~15% of the 87% during which markets move the most. That leaves us with only about 11% of the time during which markets move significantly to the downside.
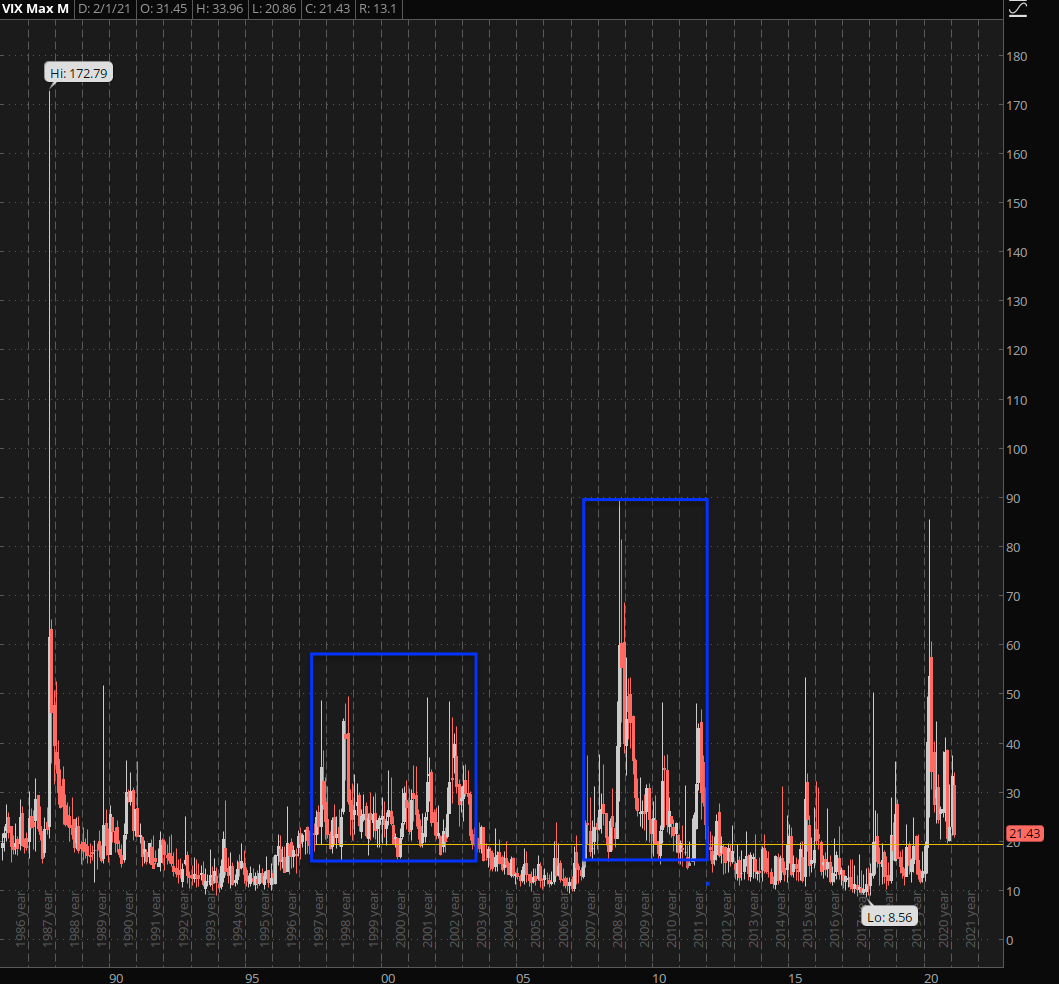
- Volatility spikes usually beget more volatility which is shown by the multi-year plateaus I have highlighted on the chart. That’s however a topic for another day.
- All these stats were present many years before the Federal Reserve jumped the QE shark, cut interest rates to zero, and pulled every conceivable trick in its considerable arsenal to bias the market to the upside.
The long term chart of the VIX I posted above makes the boring stats above abundantly clear. Although we are all idiots and our eyes are immediately drawn to the outliers you can see that the VIX spends most of its time churning in a relatively contained sideways range.
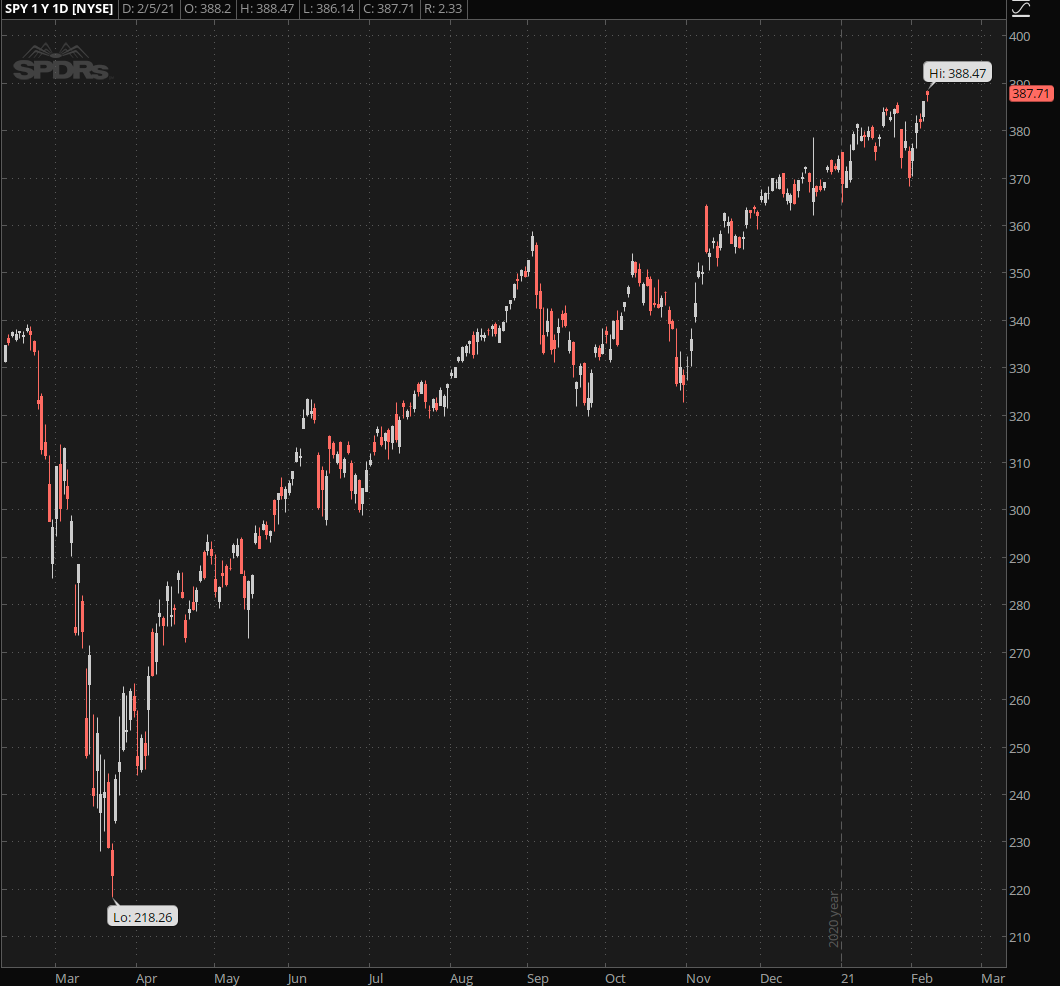
Speaking of long term charts, here’s a snapshot of the Spiders going back a decade. That second arrow from the left marks the approximate point in time when I started Evil Speculator, which now seems almost a lifetime ago.
Many of us, yours truly included, were full blown perma-bears back then and listened to pied pipers like Robert Prechter who assured us that wave 3 of 3 of 3 would take us from SPX 1000 all the way to the 200 mark or below.
Of course what happened instead was something completely different which did not deter the same actors to continue predicting similar apocalyptic events every single time the market caught as much as a sniffle (blue arrows).
Courtesy of COVID those perma bears almost got what they has waited so long for but alas the Fed stepped in once again and pissed all over everyone’s parade. Which is why we now find ourselves pushing toward the $4k mark instead of the $400 mark many of you may have hoped for.
Zooming in a little into the past year of price action I see an increasingly nervous market that however shows no serious signs of correcting. That does not mean however that I am not accumulating a bit of downside protection when the chance offers itself.
The SKEW must flow!
But this does not represent the ‘bread and butter’ part of my trading activities. What does however are strategies that exploit an exotic market condition I have continued to present here over the past year:
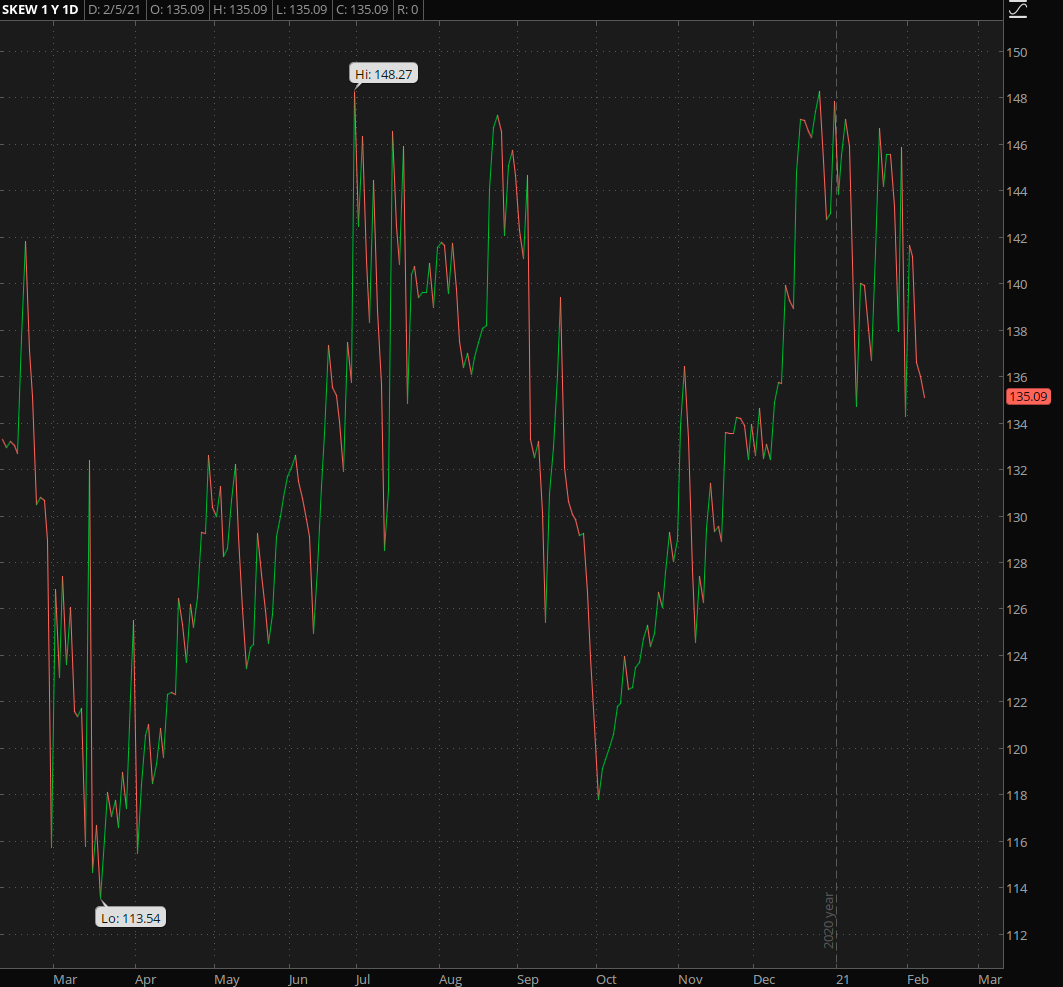
The concept of SKEW has been covered here on numerous occasions as well as the fact that we have been observing a lot of it in the options market as of late.
The overall score shown above may have dropped a little but there are a good number of symbols that are still exuding an excessive amounts of that juicy SKEW.
So let’s look at a prime example and most importantly consider how to trade on SKEW:
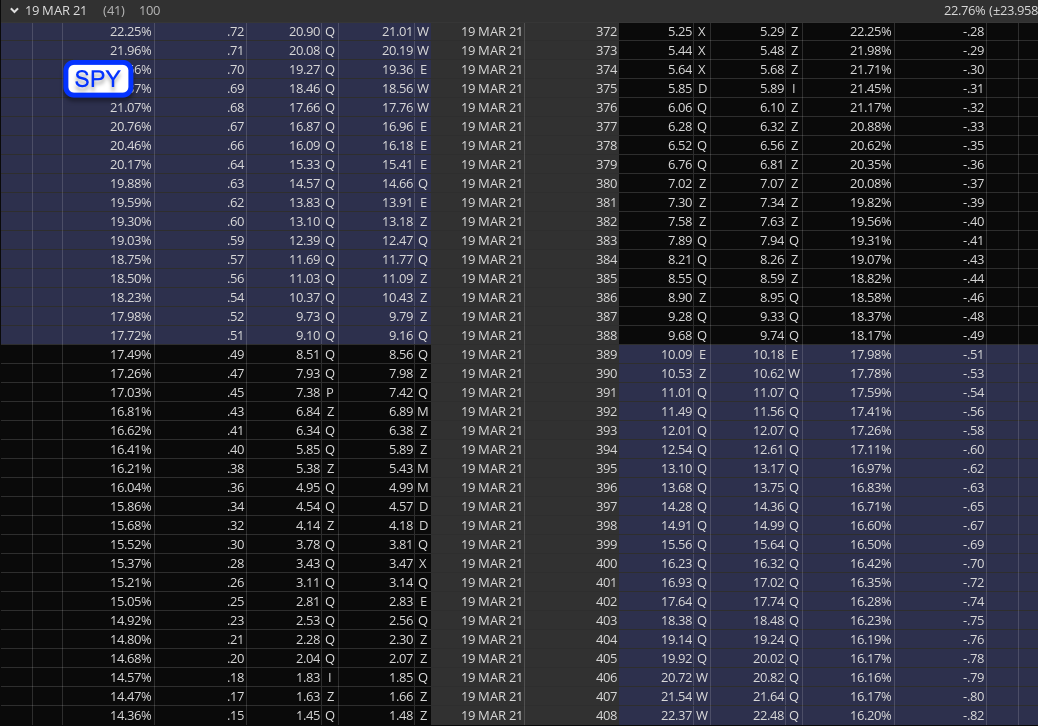
[MM_Member_Decision membershipId='(2|3)’]Well actually let’s first start with what I would call the ‘baseline’ – in this case the March option chain on the Spiders. Pay close attention to the far OTM options and the implied volatility which is the column on the far lest (on both the call and put side).
What we see here is pretty normal – puts show much higher IV than the calls as the risk is predominantly on the downside. It’s been like that since about the crash in 1987. Some of you were around back then (when dinosaurs ruled the world) and may remember that SKEW was pretty much negligible until that time.
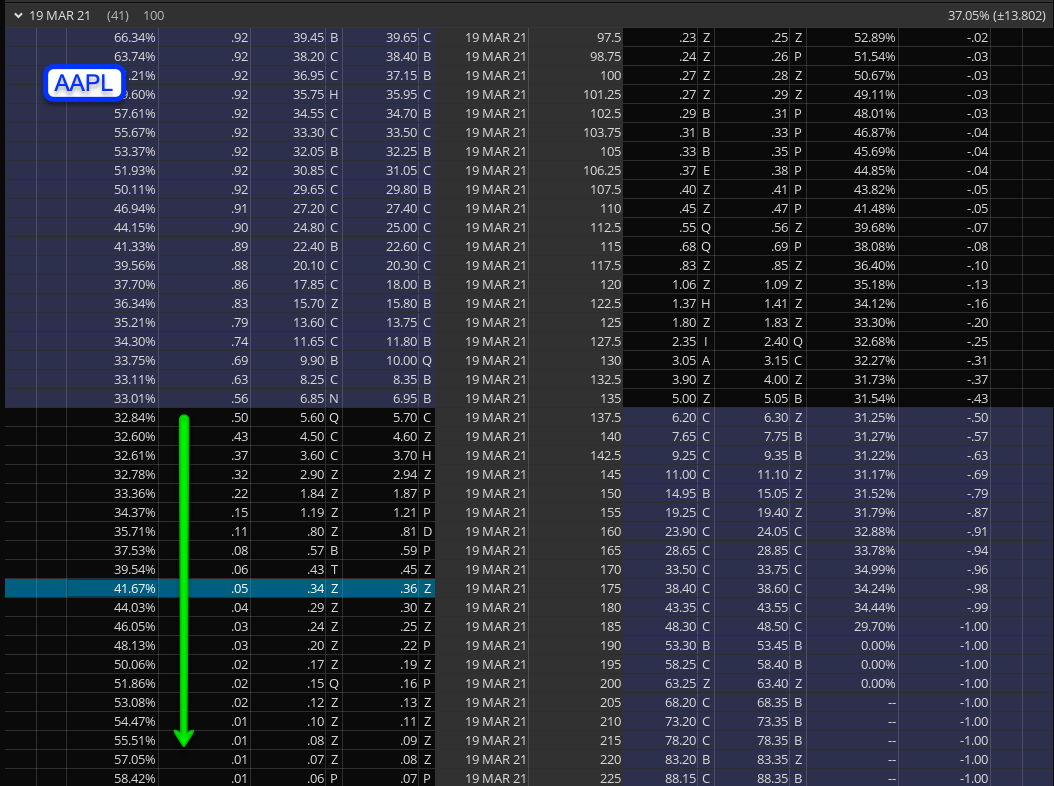
So then compare that with the AAPL chain right now:
Check out the OTM puts (right side) and compare that with the OTM calls (left side). See how the calls are actually showing HIGHER IV than the puts? That is NOT normal! And what does that mean? It means that option traders are as worried about a crash to the downside in AAPL as they are about a crash to the upside.
Meanwhile you have the VIX dropping like an anvil as it has last week despite the fact the S&P just smoked its weekly expected move twice in a row (in both directions).
This gives us a great opportunity to load up gamma iron condors (purchasing an OTM call spread while purchasing an OTM put spread – like we did last week) about three weeks out. It is called buying the gamma as it leverages possible moves outside the weekly expected move.
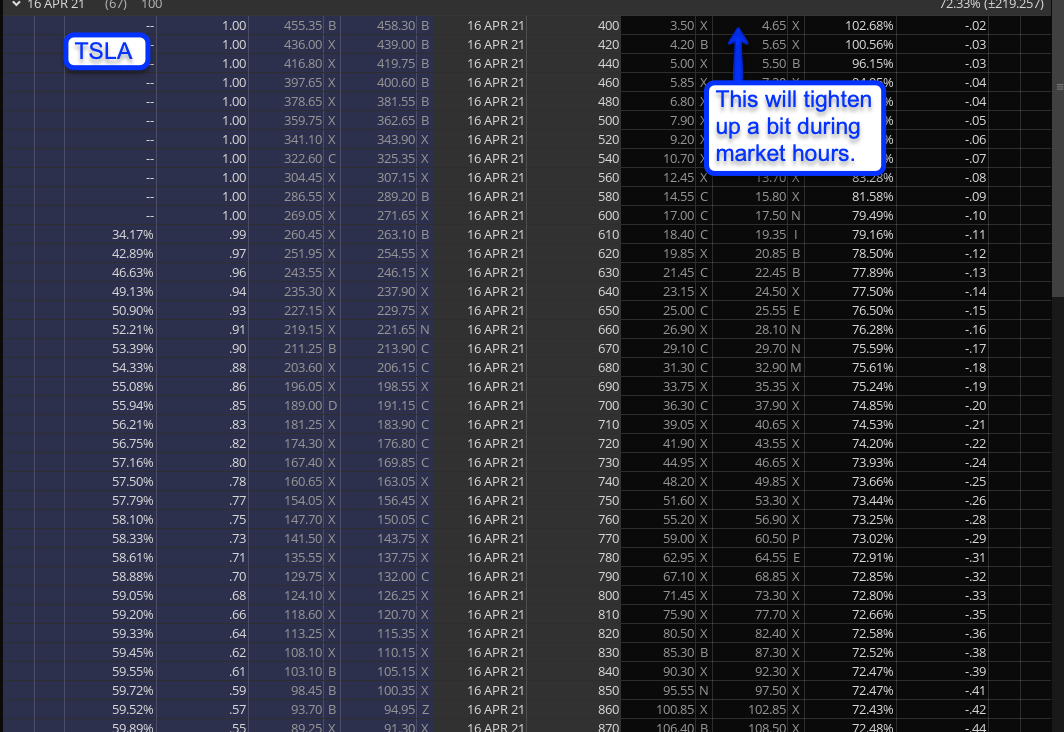
The 1700 call is going for $4.50. I mean FFS – that’s the 1700 strike!!! Now THAT is some SKEW – it’s probably the SKEW of a lifetime and although it is reminiscent of picking up pennies in front of a steam roller, consider the odds.
Is TSLA going to crash below 400 or jump to 1700 by April? Maybe but even if it ends up there the odds of it going there in a straight line are minimal, meaning you can dump it way before it pushes ITM.
WARNING
Selling options carries UNLIMITED risk and is not for the uninitiated. If you didn’t already know what SKEW is and never sold an option before then you are better off with gamma iron condors.
Shop smart – shop S-MART.
[/MM_Member_Decision]
[MM_Member_Decision membershipId=’!(2|3)’]
Please log into your RPQ membership in order to view the rest of this post. Not a member yet? Click here to learn more about how Red Pill Quants can help you advance your trading to the next level.
[/MM_Member_Decision]
[MM_Member_Decision isMember=’false’]
Please log into your RPQ membership in order to view the rest of this post. Not a member yet? Click here to learn more about how Red Pill Quants can help you advance your trading to the next level.
[/MM_Member_Decision]

