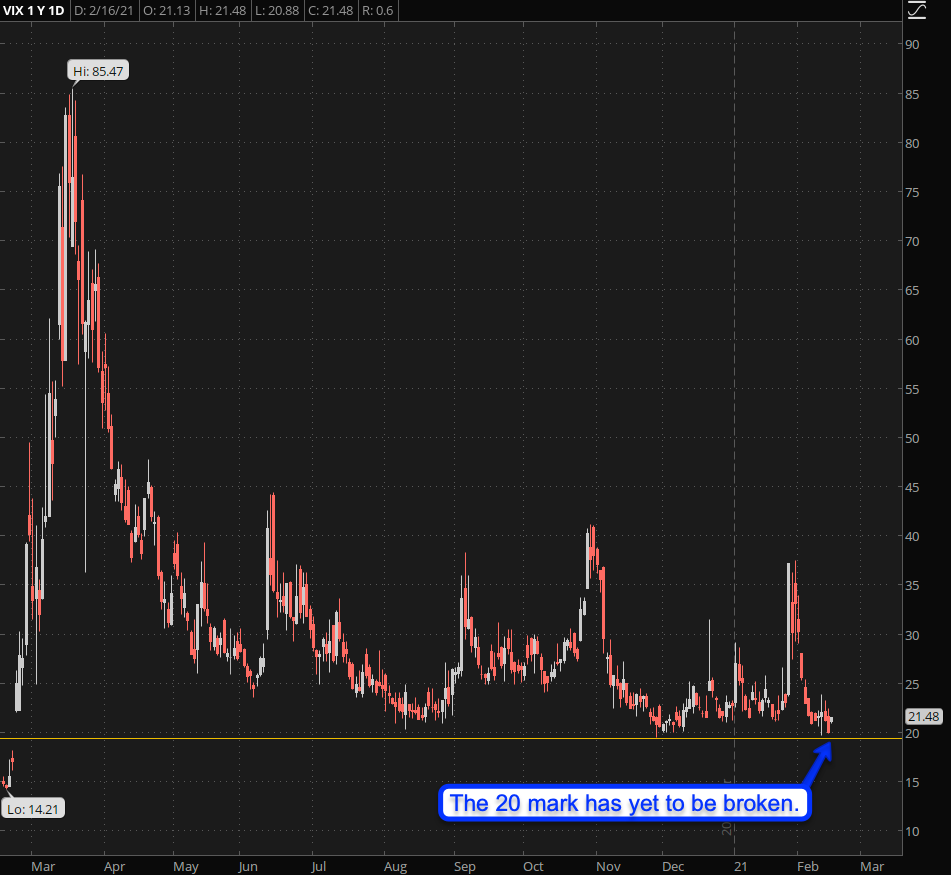
Implied volatility has been dropping faster than an ACME anvil over the past two weeks, which stands in stark contrast to what I am seeing in the bonds market so the jury is still out whether or not we are looking at some bifurcation here (strange things happen sometimes) or if risk is being improperly handicapped. If it is the latter then we may see another Gamestop type situation unfold in the near term future – if it’s the former then retail traders are about to get a wedgie of biblical proportions.
On the surface everything is looking pretty hunky dory with the VIX back to pre-COVID levels, albeit the 20 mark has yet to be decisively cleared (there as a dip below it on Friday).
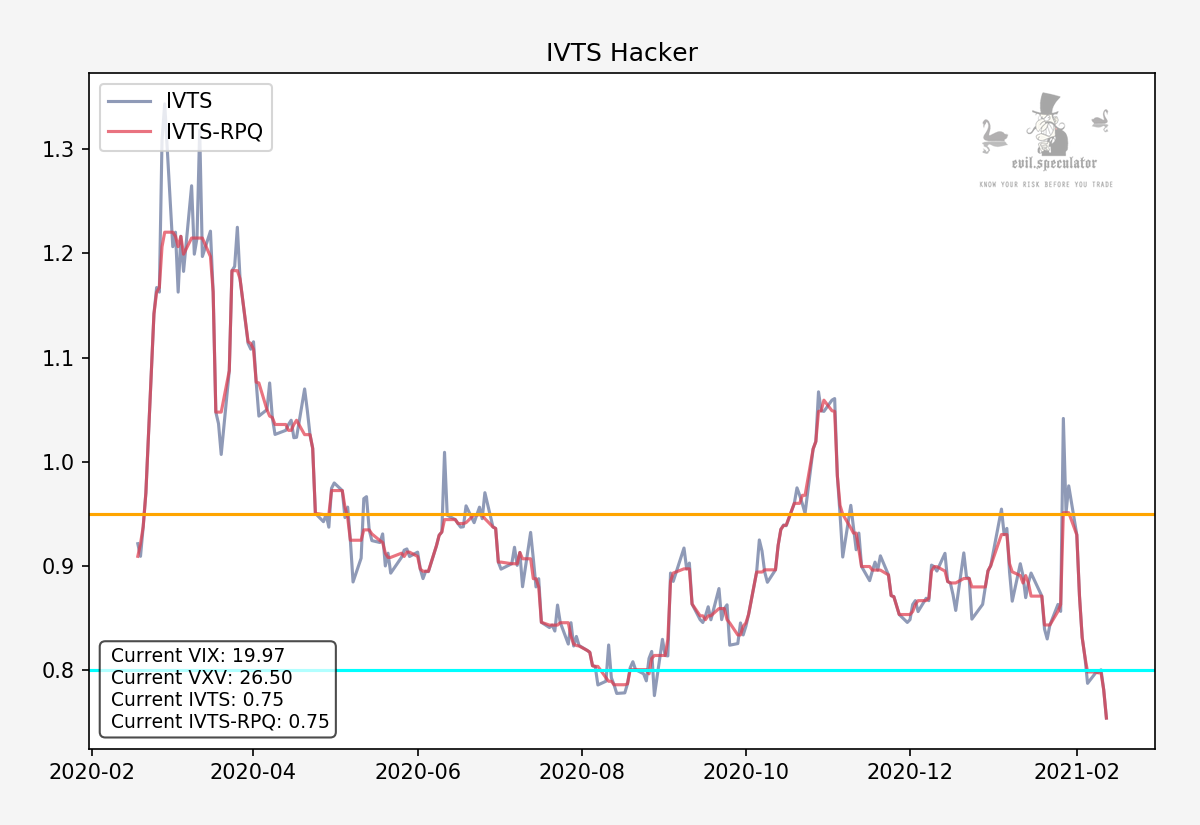
The implied volatility term structure is also in a quick dive pattern and I honestly cannot remember the last time I’ve seen this ratio at the 0.75 mark – it’s been at least a year.
But if you look closer you start seeing the first cracks in the armor. Note that the VIX is now near 20 with the VIX3M (formerly VXV) still all the way up at 26.5.
And that’s where things start to get really interesting. If you take a peek at the VX product depth graph then you’ll see even higher prices for VX contracts further out toward the summer. And excessive contango in the VX futures usually is the harbinger of tough times ahead.
Because according to my stats it is in fact retail that’s gobbling up VIX related positions (mostly in related ETFs like VXX or UVXY). And yes albeit it’s possible that retail has it right and the evil quants and market makers have it all wrong this is giving me a lot of pause.
Especially if you consider this:
[MM_Member_Decision membershipId='(2|3)’]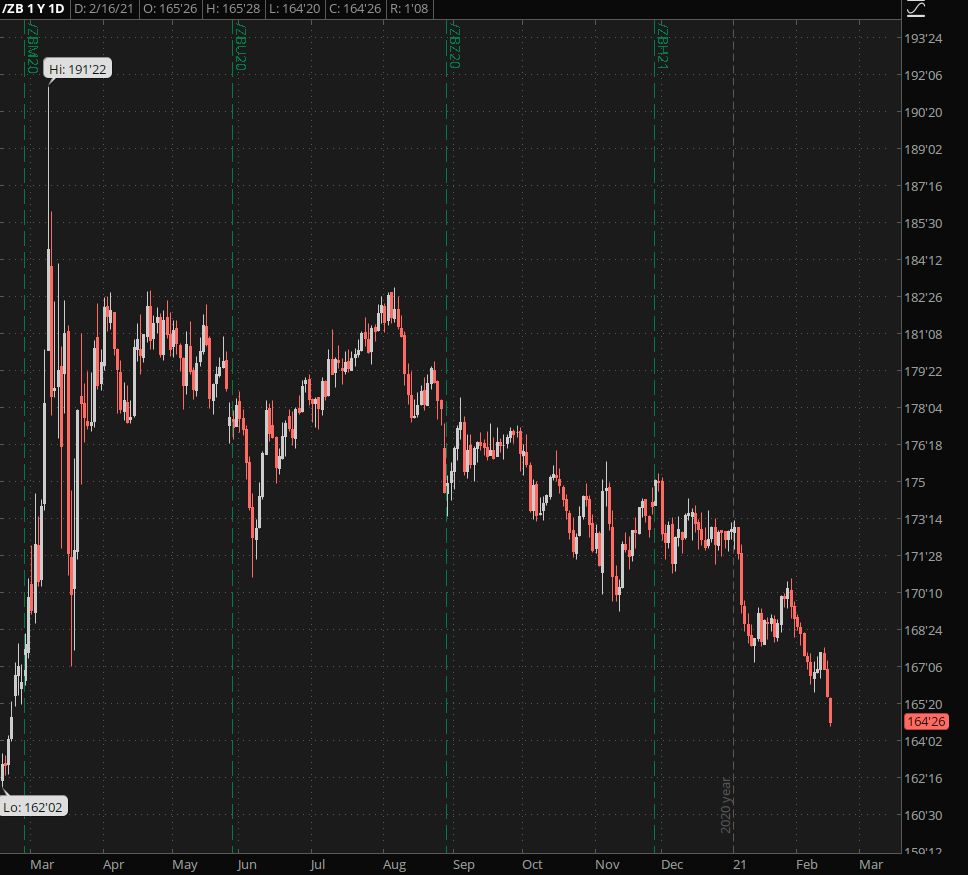
Yes, I did mention it in my intro but it bodes repeating. Bonds continue to fall like a rock and you know what that means – rising yields. Which poses the question if the Fed has finally reached the point where fanning Dollar inflation and excessive Federal spending is tantamount to pushing on a string.
Now that doesn’t mean I’m going to back up the truck and load up on far OTM puts right now. But I would strongly suggest that you dot your is and cross your ts when it comes to your long exposure and especially if you find yourself heavily delta positive. A bit of hedging goes a long way when things go wild.
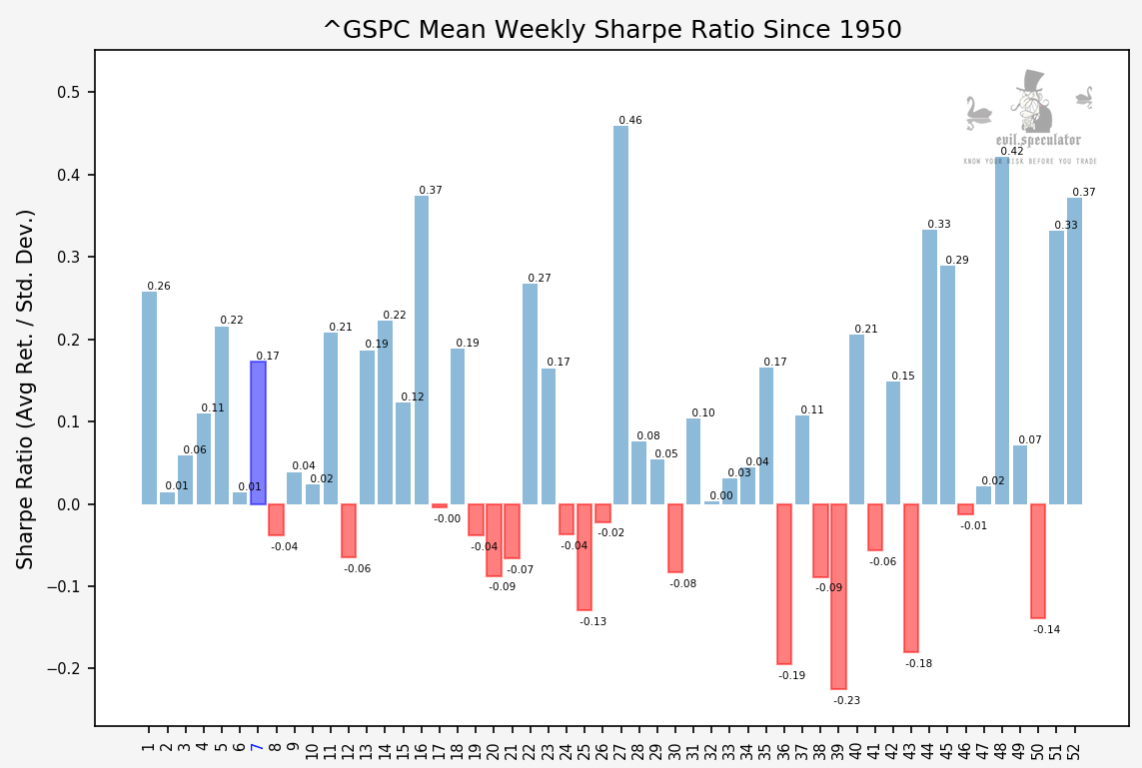
Alright here are the weekly statistics:
Sharpe ratio for week #7 is not bad at all at 0.17 on average. What I like even better however is this:
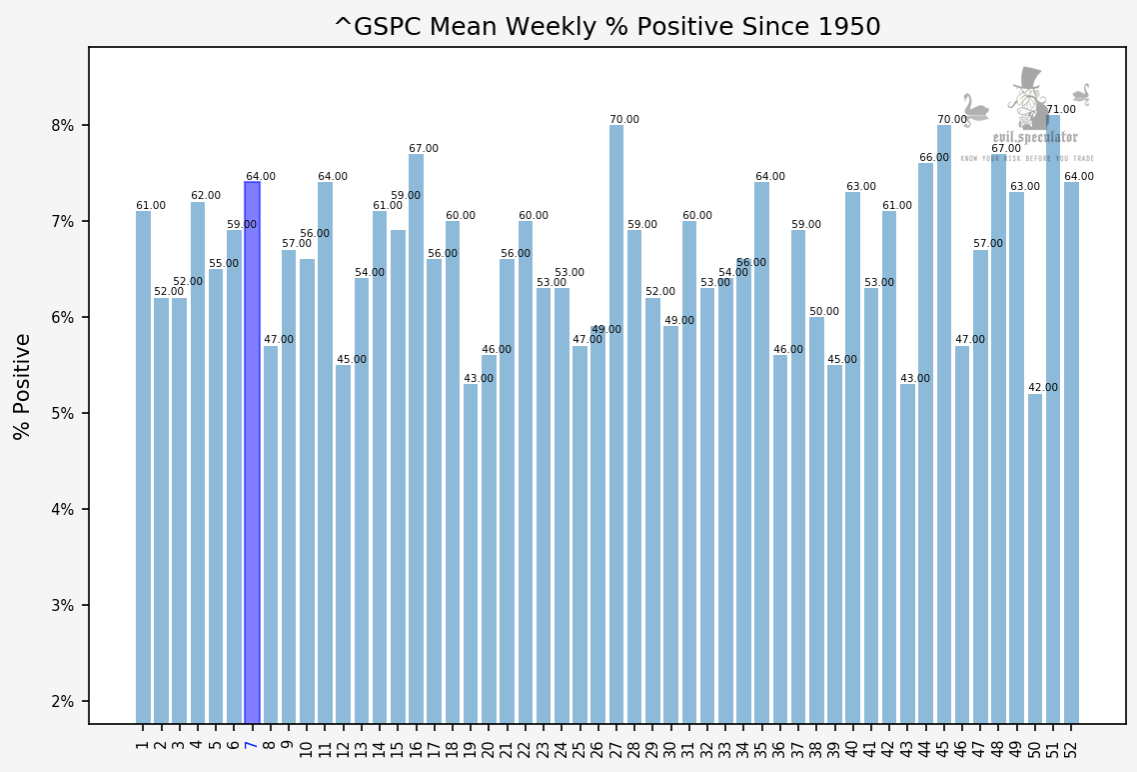
Mean weekly percent positive is at 64 and that ain’t bad.
President Dale agrees.
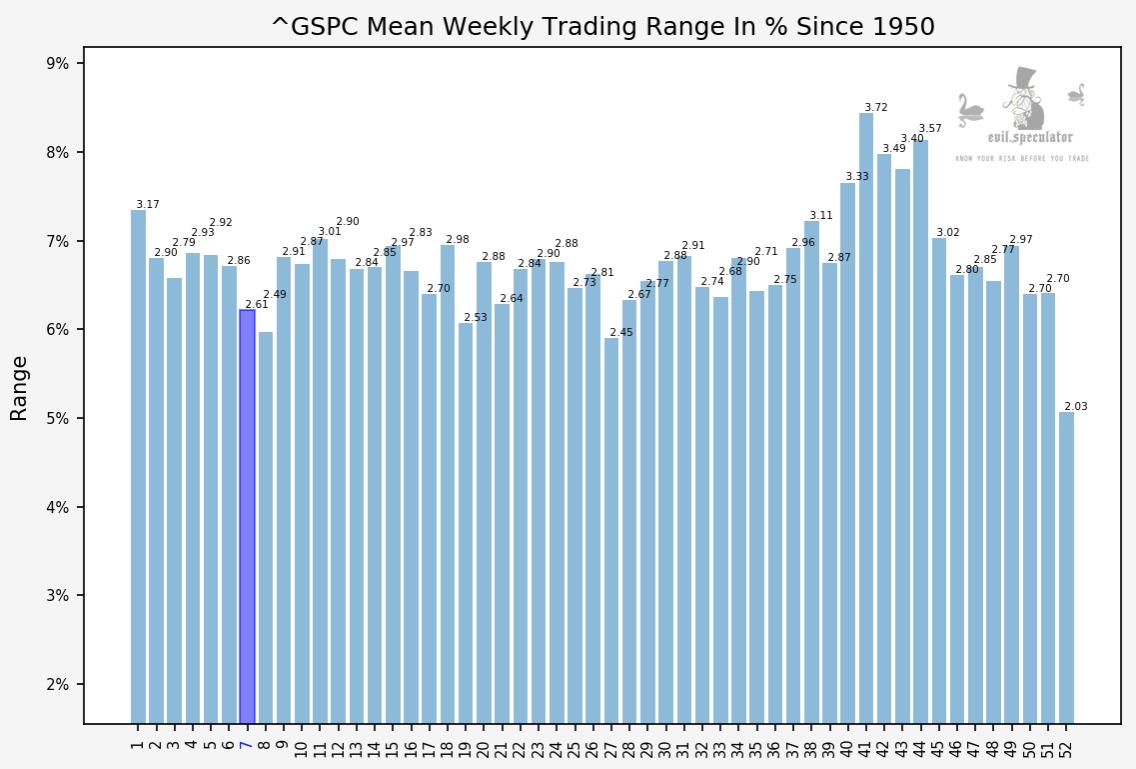
In addition we are looking at a smaller trading range than the average, which means that if things go bonkers in February then it’s probably going to be toward the end of the month or in early March.
No guarantees of course and if the situation changes or if I see additional cause for concern I’ll be sure to fill you in promptly.
Happy trading but keep it frosty.
[/MM_Member_Decision] [MM_Member_Decision membershipId=’!(2|3)’] Please log into your RPQ membership in order to view the rest of this post. Not a member yet? Click here to learn more about how Red Pill Quants can help you advance your trading to the next level.[/MM_Member_Decision] [MM_Member_Decision isMember=’false’] Please log into your RPQ membership in order to view the rest of this post. Not a member yet? Click here to learn more about how Red Pill Quants can help you advance your trading to the next level.
[/MM_Member_Decision]


