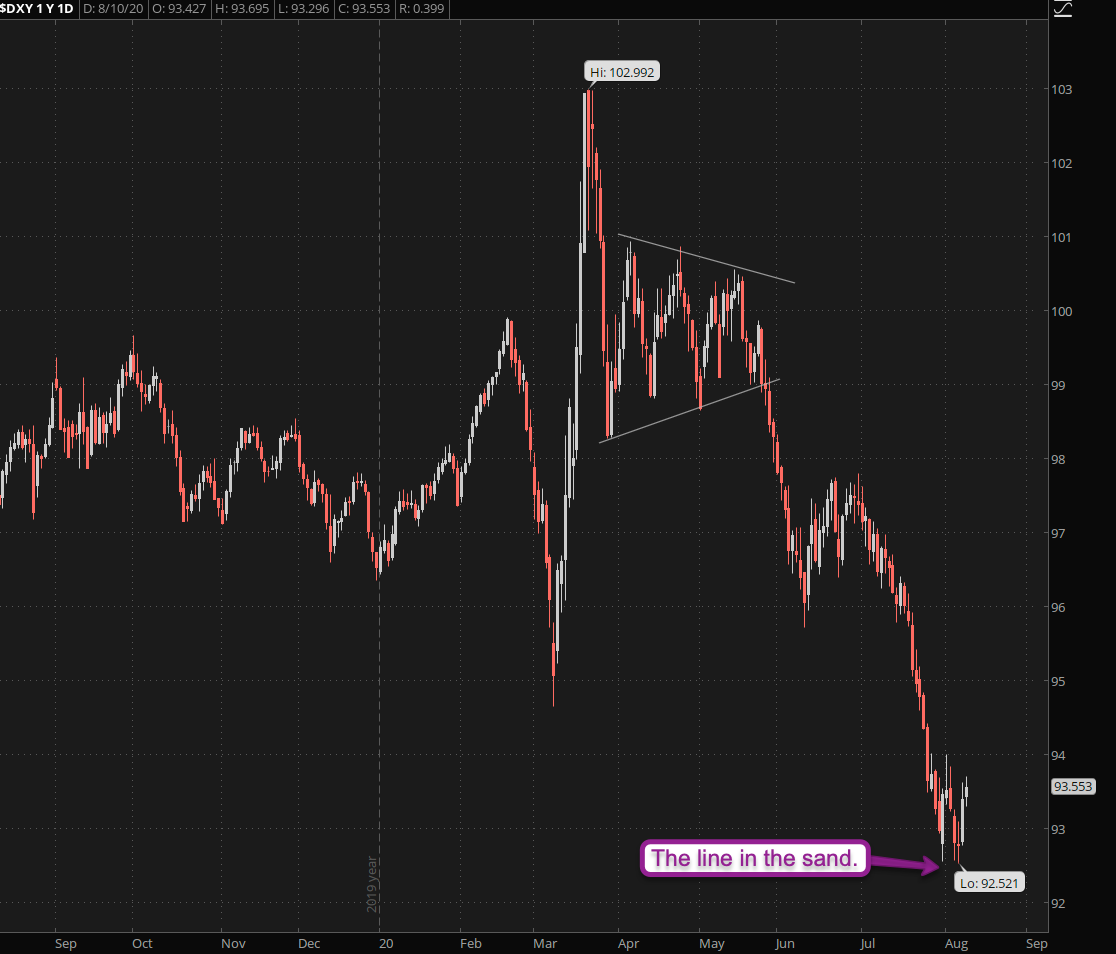
The greenback seems to be in the process of forming a floor pattern despite ongoing negative narrative by the financial MSM. Although I happen to have a dog in this fight my general perspective remains to be one of skeptical optimism as the Fed continues to exert massive headwind against a stronger Dollar.
That’s a pretty clean looking double bottom on the DXY and although that doesn’t mean a medium term floor is chiseled in stone the odds for at least a quick bounce have increased markedly. However it’s also a bit of a double edged sword in that a breach of 95.5 would most likely lead us straight into the basement of Hades.
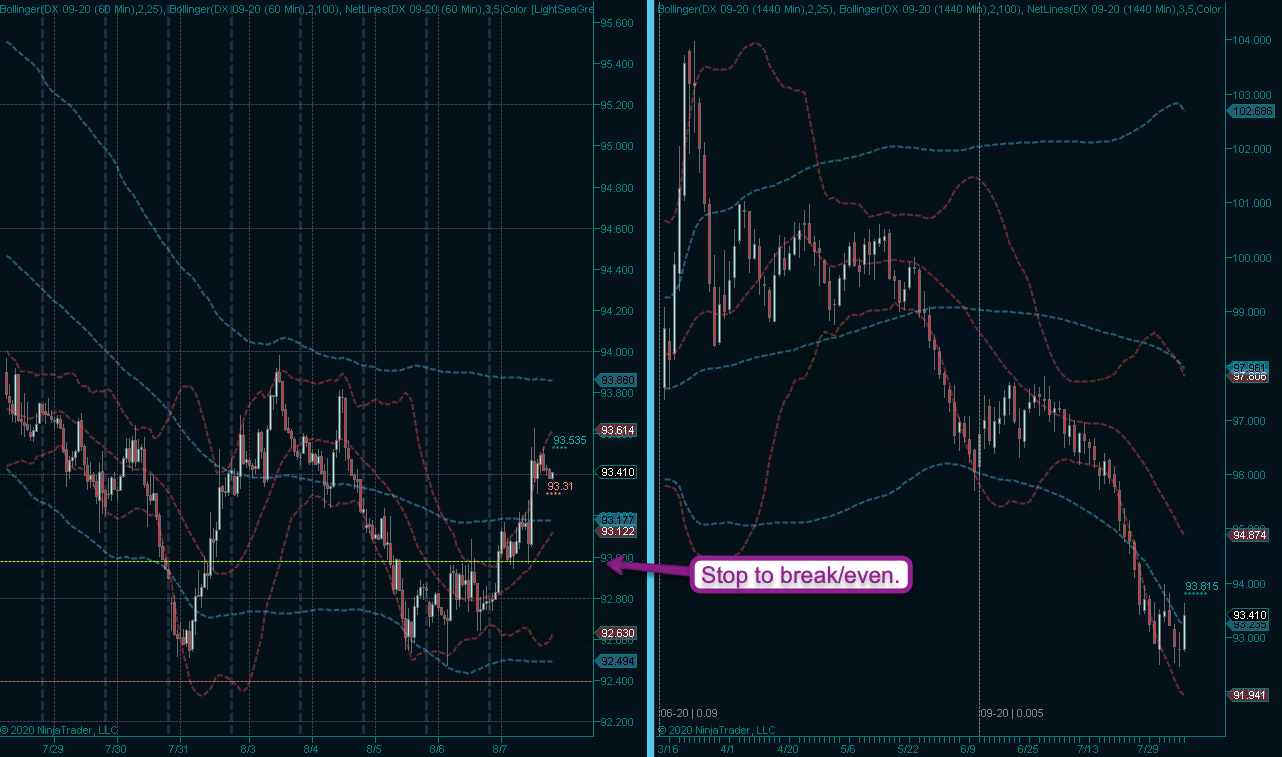
My exploratory DXY campaign is starting to look like it may just survive the week. As it barely scraped the 1R mark I am permitted to advance my trail to break/even. If you are a sub and have followed me into the abyss on that one I suggest you do the same.
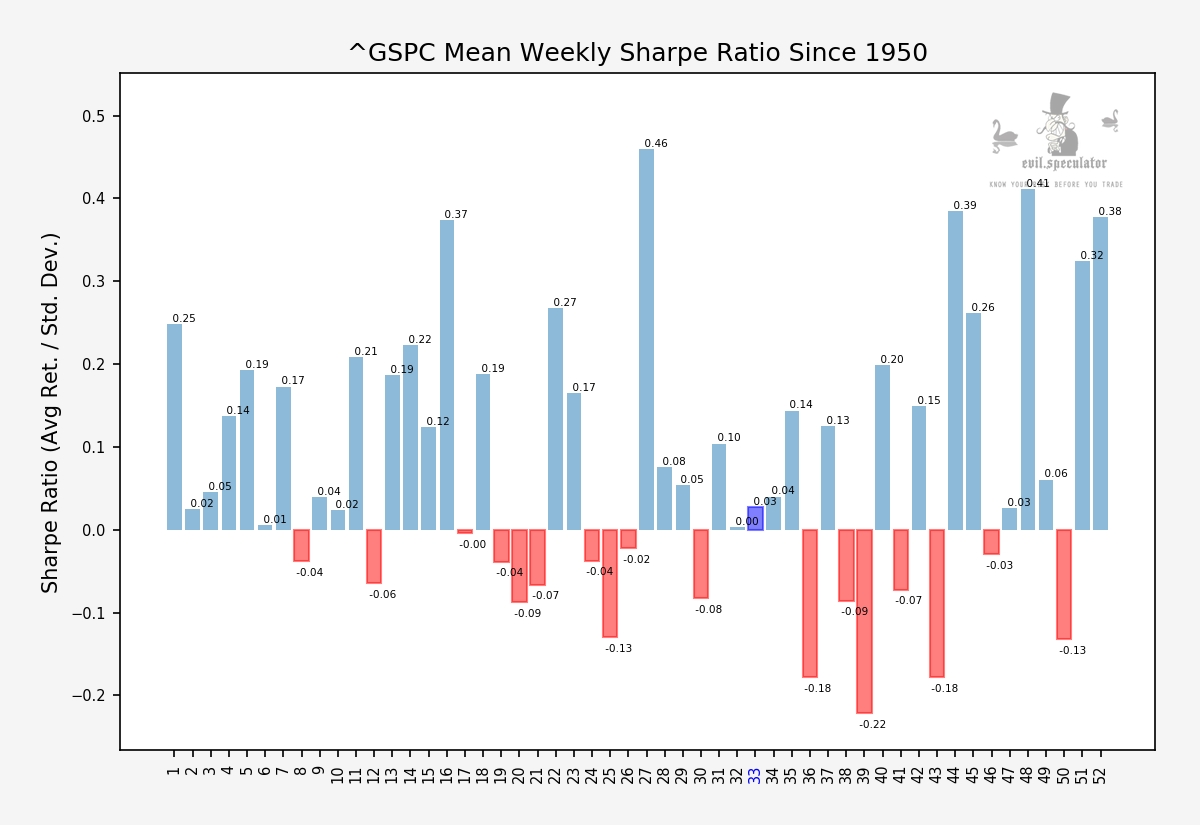
As it’s Monday we’ll look at our weekly stats starting with the Sharpe Ratio for week #33. The good news is that things are looking up a bit and will be improving over the course of the next two weeks.
However once we pop open the hood and look at bit deeper things get a wee bit more complicated:
[MM_Member_Decision membershipId='(2|3)’]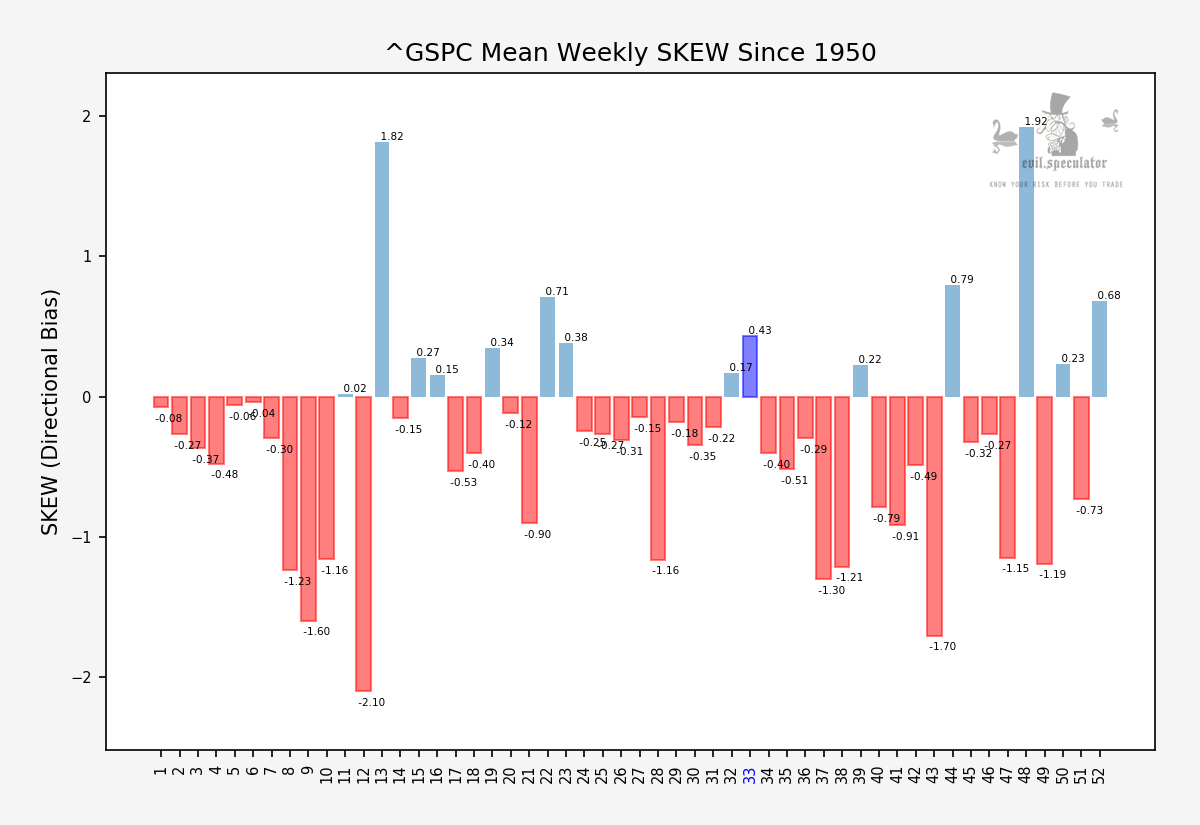
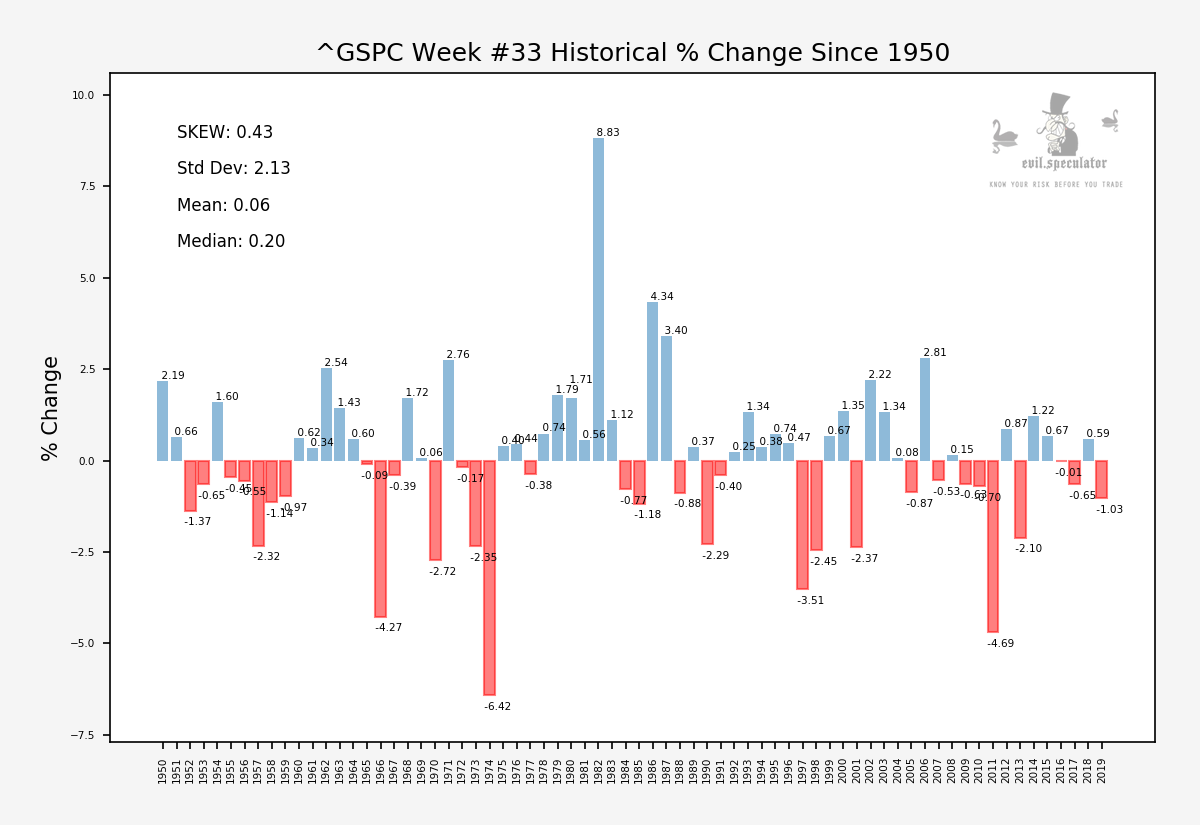
SKEW tells us how the ‘leaning’ of our data set distribution and it’s positive for week #33, which may sound good but it’s actually a negative as explained in the graph below:
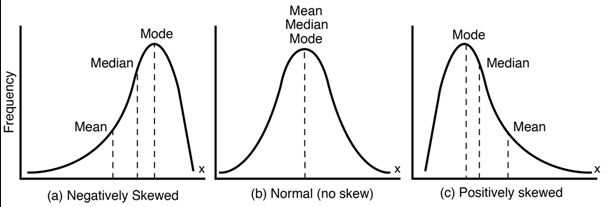
The ‘positive’ leaning actually refers to the relationship between the median and the mean – at least that’s how I usually remember it. With positive SKEW the mean leads the median, which is a another way of saying that the average is elevated courtesy of a few outliers, if that makes more sense.
The percent change sheds a bit more light on this. As you can see there were a few large outliers in the 1980s that pushed us over the edge on the average, but the median is lagging due to the fact that the negative week outweigh the positive weeks.
What that means in English is that week #33 closes positive on average but that fact is pretty meaningless as it swings wildly to both sides with the negative side being a bit more volatile than the positive side.
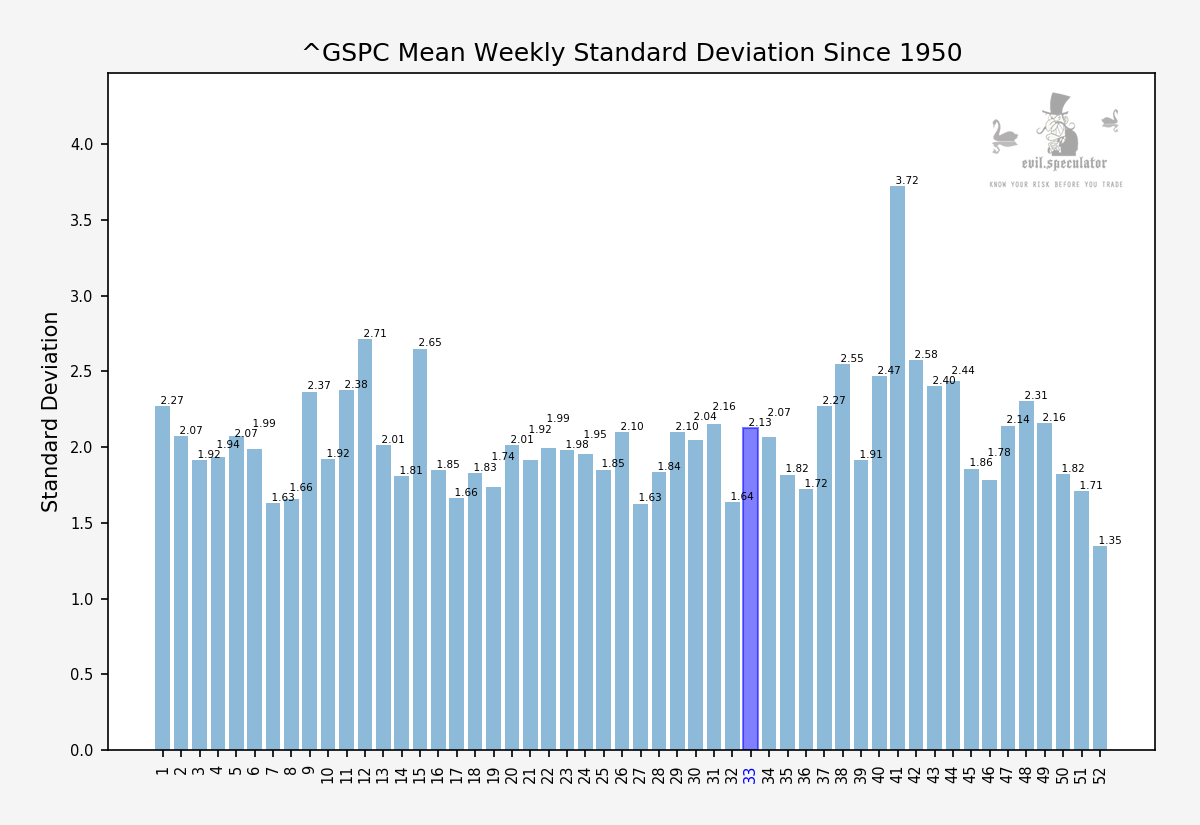
Not surprisingly standard deviation shows that with a reading of 2.13 – the highest of the month, despite the fact that the final week is usually a negative one.
Bottom Line
We are in the midst of the summer low season and expect the bots to bang the tape all over the place without mercy. Not a good week for directional bets – play theta burn or volatility instead if that’s part of your trading arsenal.
[/MM_Member_Decision] [MM_Member_Decision membershipId=’!(2|3)’] Please log into your RPQ membership in order to view the rest of this post. Not a member yet? Click here to learn more about how Red Pill Quants can help you advance your trading to the next level.[/MM_Member_Decision] [MM_Member_Decision isMember=’false’] Please log into your RPQ membership in order to view the rest of this post. Not a member yet? Click here to learn more about how Red Pill Quants can help you advance your trading to the next level.
[/MM_Member_Decision]


