I hate election years with a passion in general but have to say that 2020 definitely took the cake. The good news is that the big day has finally come and it’s fair to say that November 3rd will be one of the most pivotal elections in our lifetime for each of us. I don’t care which way you swing politically, but you owe it to yourself to go out there and place your vote. If you fail to do so you be advised that you have lost your mandate to bitch and complain after the fact if you happen to dislike the outcome. If I can do it all the way over here from Spain then everyone else can.
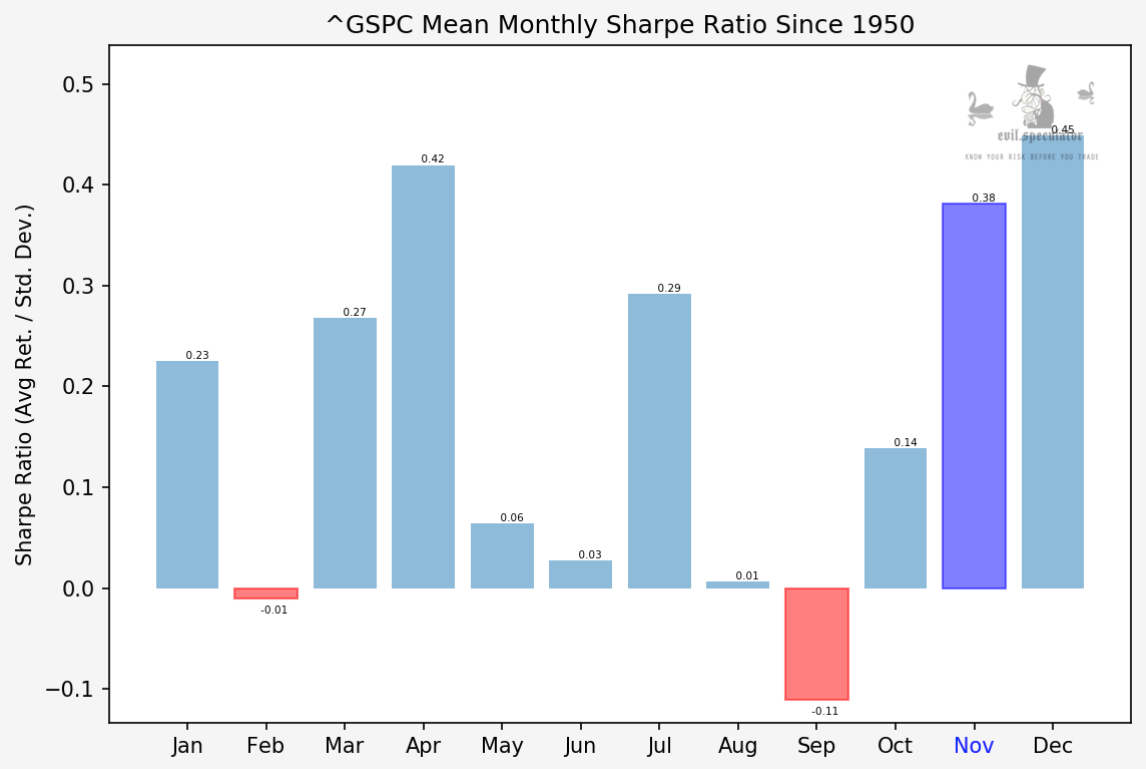
But you didn’t come here for more political chatter so let’s get to the monthly stats for November. Which look pretty damn juicy I may add with an average Sharpe ratio of 0.38.
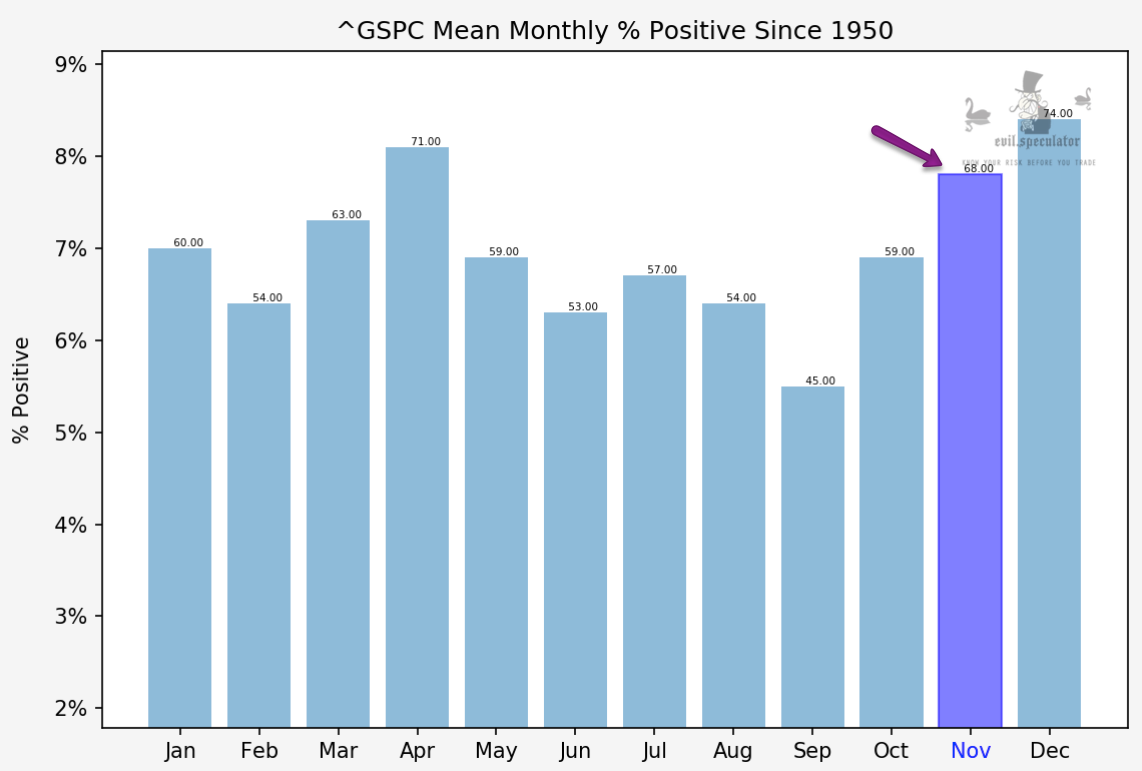
Percent positive looks even better at 68% and yes, that does include election weeks for the entire dataset.
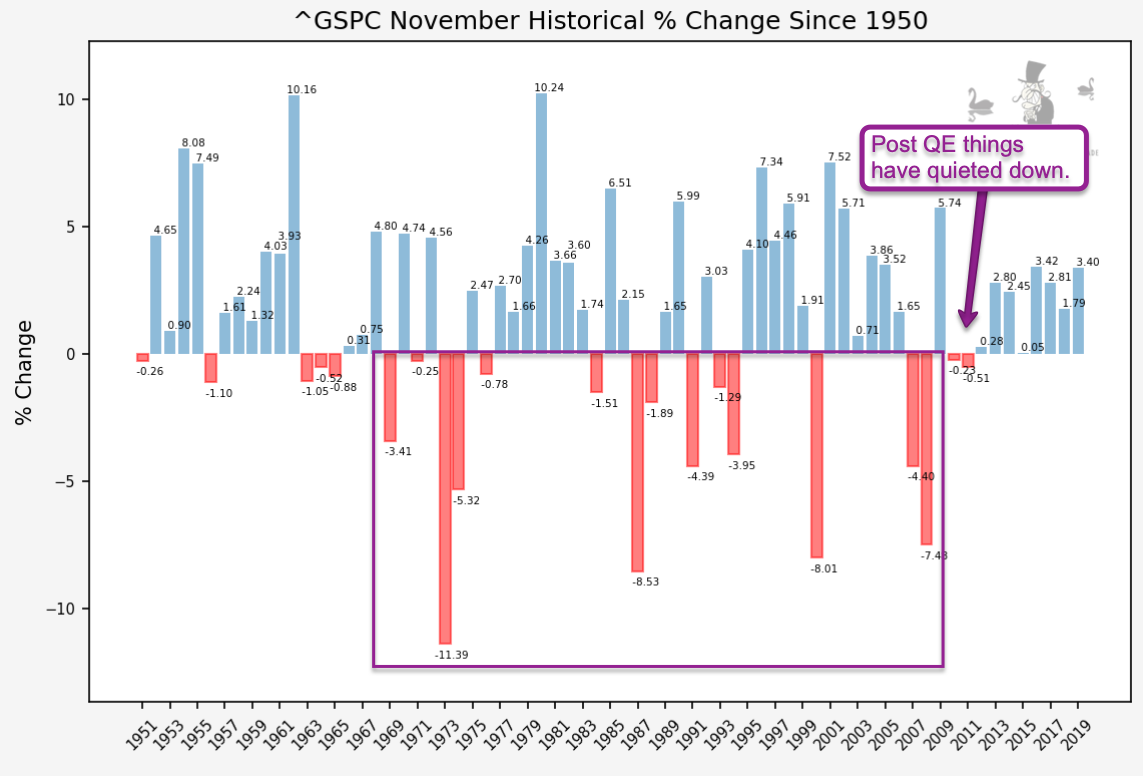
Speaking of which here it is going all the way back to 1950. Since about the year I was born we used to see the occasional wipeout but things have quieted down considerably since QE and other Fed shenanigans became common practice.
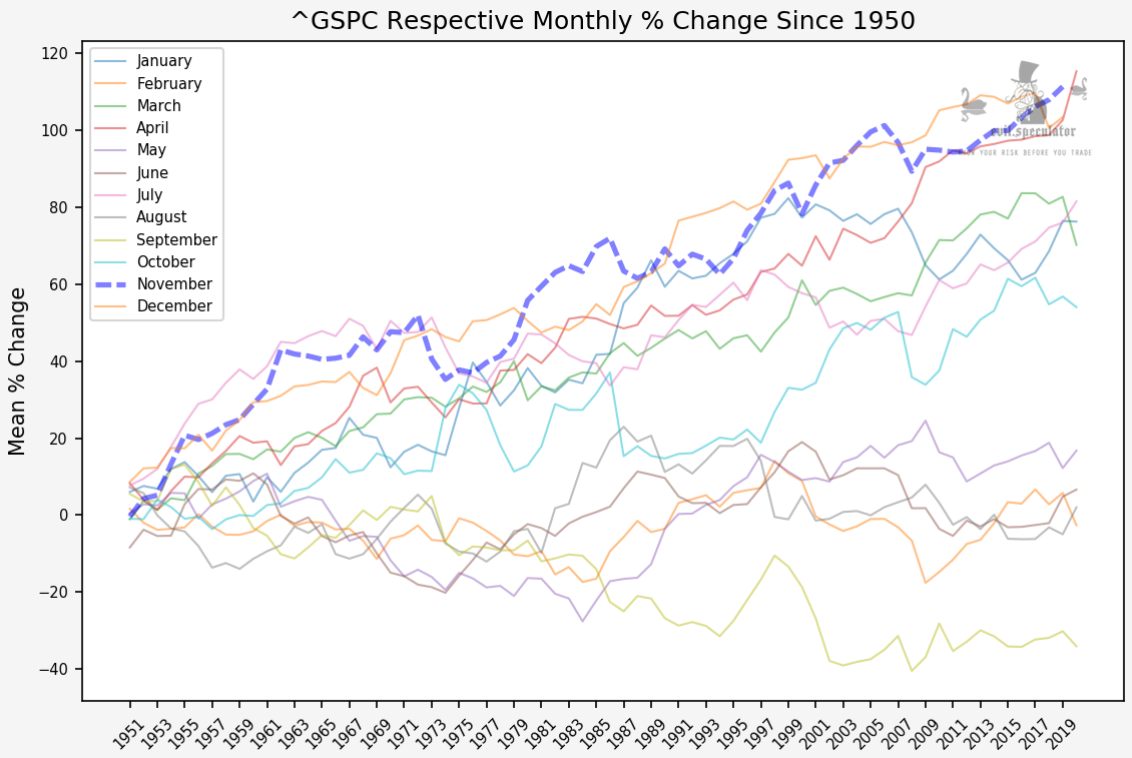
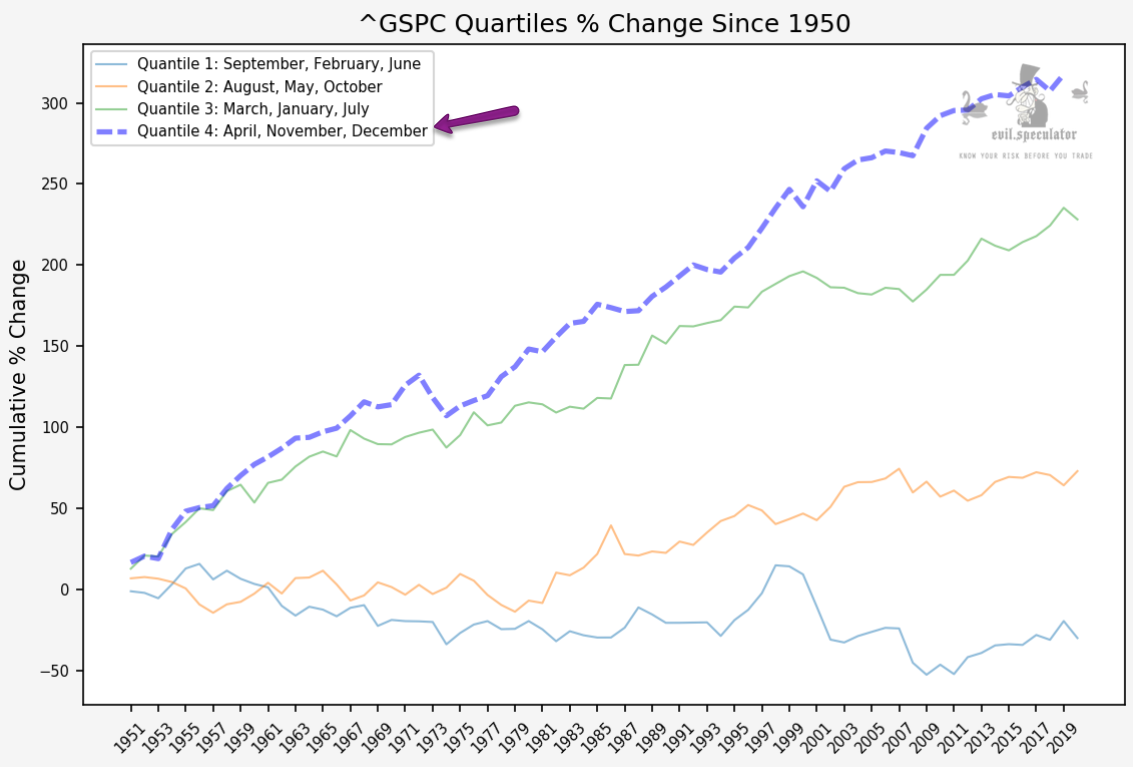
Overall November ranks as the 2nd most positive month of the year right after December followed by April. This means that had you gone long the market on the first trading day of November and cashed out on the last then you would be sitting on pretty juicy profits by now, especially considering compounding.
How April slipped into that quantile is beyond me but perhaps everyone gets giddy and ready to bet on black ahead of May after a long chilly winter. Good news by the way – traffic accidents for the 2020/2021 winter season will drop to record lows. Bad news – it’ll be because we’ll all be locked inside. J/K.
Now let’s look at the stats for week #45, which look even better:
[MM_Member_Decision membershipId='(2|3)’]
It’s fair to say that the first and final weeks of the month are responsible for most of the profits. Keep that in mind IF we see a big move this week as the next two will probably be flat as the voters digest and analyze the results. Post election periods are always a time of transition plus the 5 stages of grieve apply:
- denial
- anger
- bargaining
- depression
- acceptance
Percent positive just for week #45 looks very similar to the monthly c
Here’s the weekly historical percent change graph plus a few other stats for your stats nerds. This looks very similar to the monthly November graph and it supports the notion that week 1 and 4 of the month are the most positive.
Percent positive for this week is outstanding at a whopping 70%. Remember that this is independent of who got elected. Meaning most likely even a temporary wipeout may be a good BTFD opportunity.
Finally percent change which shows us a range 0.49 – not surprising as we should expect movement during a presidential election. But it’s a lot less than would one assume, which goes to show that much of what is insinuated in the MSM is pure hype otherwise it would rank among the top 3 biggest movers.
Happy hunting but keep it frosty.
[/MM_Member_Decision] [MM_Member_Decision membershipId=’!(2|3)’] Please log into your RPQ membership in order to view the rest of this post. Not a member yet? Click here to learn more about how Red Pill Quants can help you advance your trading to the next level.[/MM_Member_Decision] [MM_Member_Decision isMember=’false’] Please log into your RPQ membership in order to view the rest of this post. Not a member yet? Click here to learn more about how Red Pill Quants can help you advance your trading to the next level.
[/MM_Member_Decision]


