Once again the week started out with an attempt to ignore seasonal bias but then slowly degraded as time went on. Let’s be clear, the bulls had a perfect shot at recovering the ball and controlling the game again but then fumbled only yards from the end zone. Looking at the overall market it’s easy to assume we’re only looking at second dip buying opportunity but if we did a bit deeper things are looking a lot less optimistic.
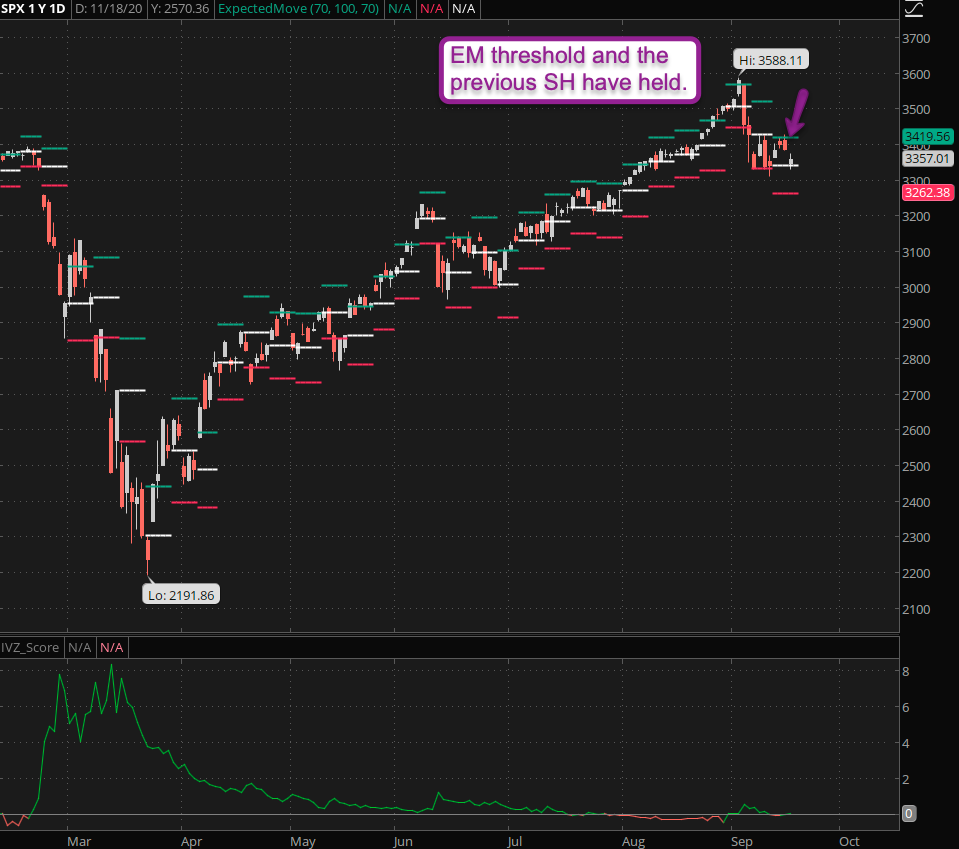
This week’s expected move (EM) threshold once again proved to be an important inflection point. A push beyond it would have triggered a ton of margin covering activity. Especially since it lines up closely with a previous spike high (ES 3425) we painted on Wednesday of last week.
Which also means we now have a well established overhead resistance threshold that we can use to plan our future campaigns. If you’re short the Spiders or the SPX then a stop loss a little bit above that threshold is advisable.
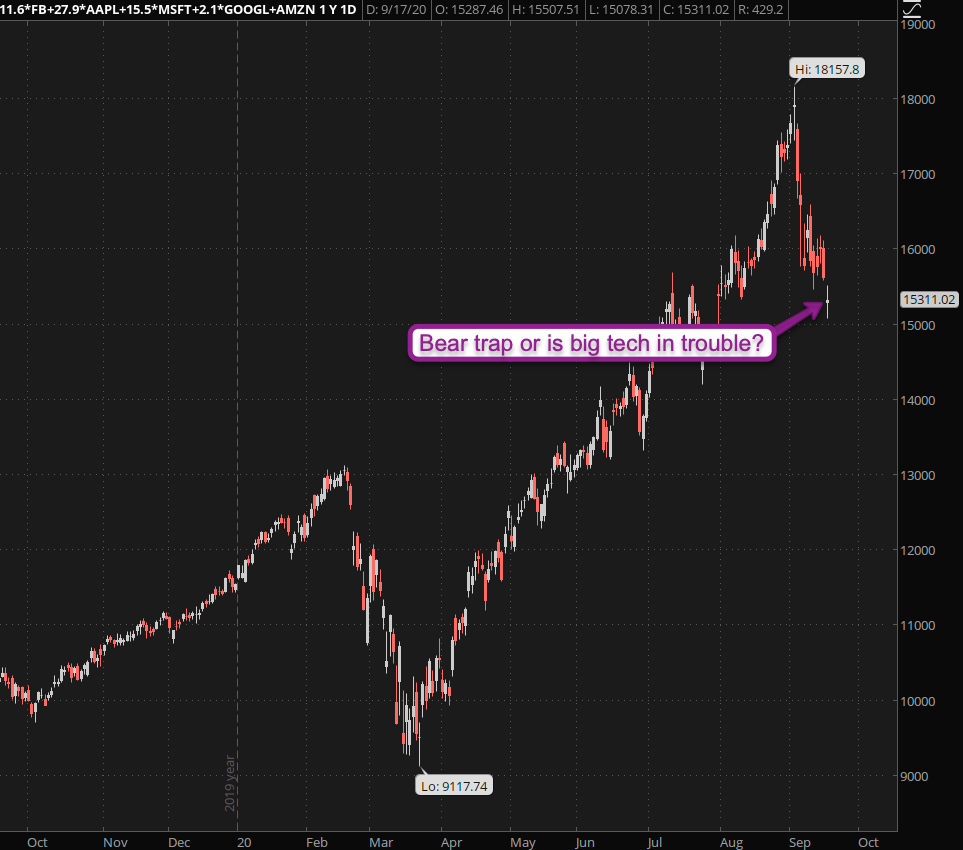
I talked about ‘digging deeper’ and what I am referring to in particular is the theme I have been harping on about for the past two weeks: BIG TECH.
Well it’s failing and my ‘monsters of tech’ composite symbol comprised of FB, MSFT, AAPL, AMZN, and GOOGL is starting to look increasingly bearish.
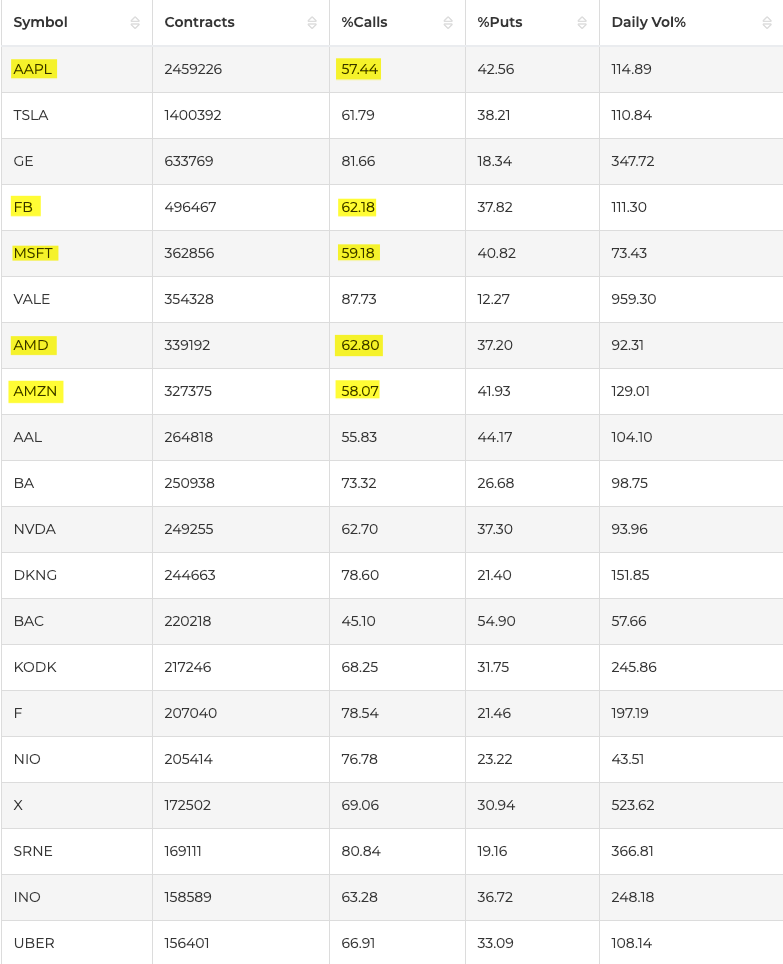
And once again it’s not for a lack of trying. I’ve posted this OCC list of the most active options contracts repeatedly over the past week or so. Every single time call volume across big tech outweighed put volume on average at a 3/2 ratio.
However as you can see that is slowly changing now as tech stocks across the board continue to slip. If you think about it however – this has huge implications as to what may happen next:
[MM_Member_Decision membershipId='(2|3)’] Think about it – there are only two scenarios that are most plausible right now.- It’s a bear trap and we bounce from here.
- We are heading into a more extended medium term correction and a lot of call options are going to expire worthless.
I know what you’re going to say. ‘Gee, a 50/50 proposition. I’ll just flip a coin then, thank you very much.‘
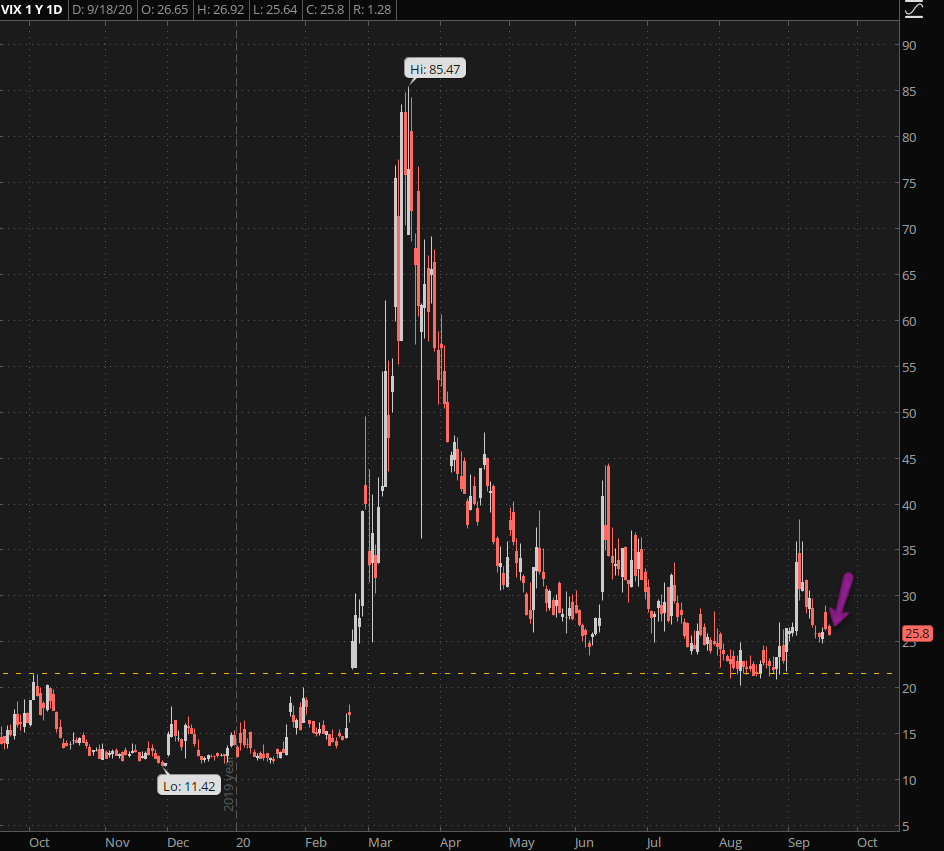
And you would be right. But what you may not considering is implied volatility which at this point is still elevated (it’s 2020 after all) but has come down quite a bit since the big spike two weeks ago. Despite the fact that we are trading at almost the same price levels.
If big tech breaks through current support levels expect IV to explode a lot higher, which would benefit both call as well as put options of course. And it’s quite reasonable to assume that we’re going to see a big move either way and that soon.
If big tech holds and bounces back I do expect a drop in IV but most likely it’ll stabilize somewhere around the 23 mark. Given that I am considering buying a few OTM put options in combination with buying a handful of vertical call spreads.
There are sophisticated ways to play both sides via options and I touch on that in my Options 201 course as well as in my upcoming course that focuses on butterflies.
Having set the stage let’s now look at some of the most salient symbols, starting of course with big tech:
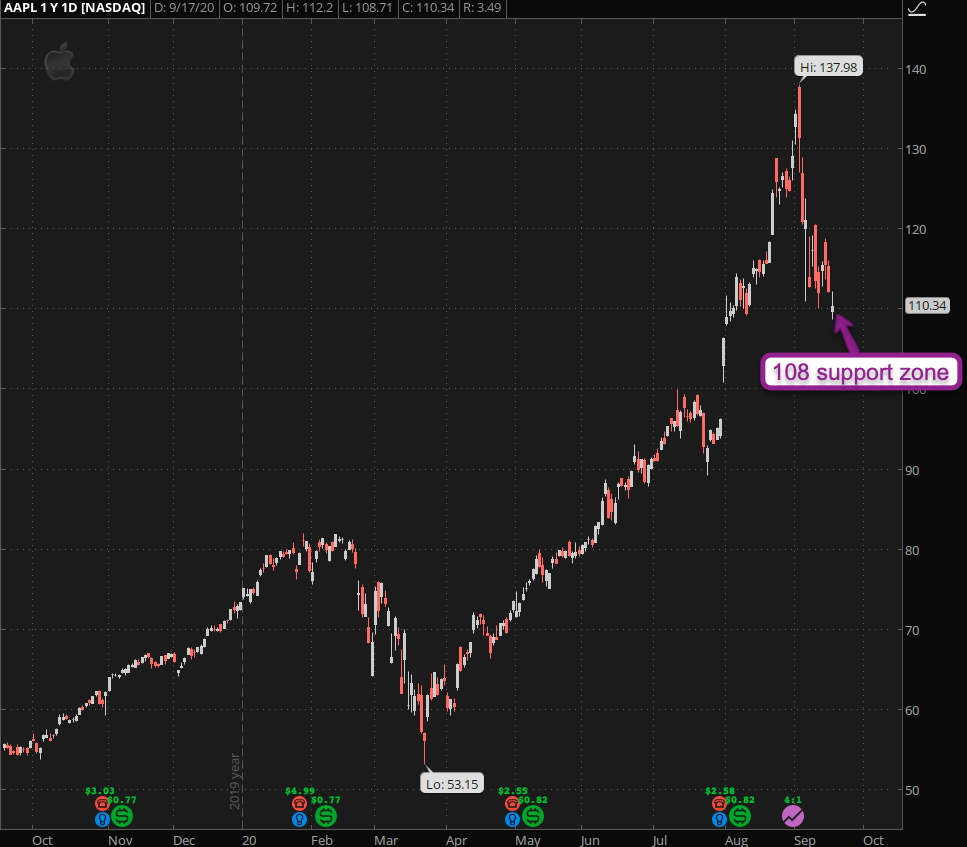
AAPL is currently hovering above a previous gap it painted in late July. I’m drawing the line here at around 108. A break lower and through that gap most likely turns it back into a double digit stock.
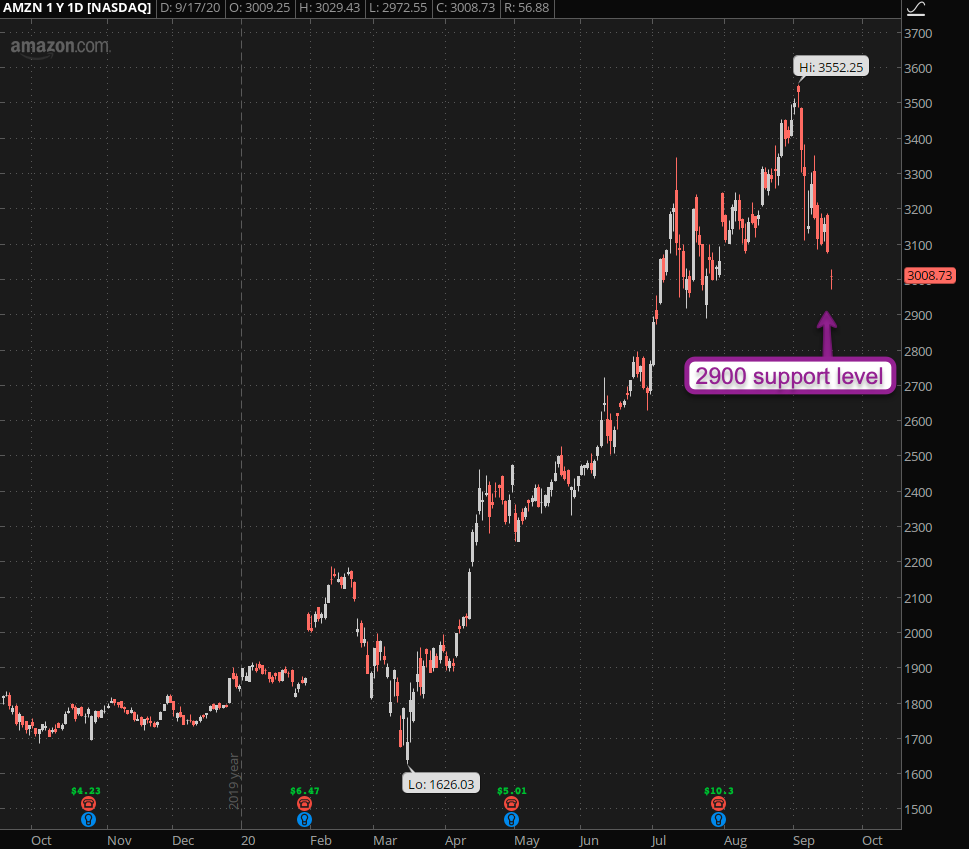
AMZN is a bit harder to read but I’d probably to around 2900 as it’s a nice fat round number. 3000 and some change is where we are now but we have a few spike lows from back in July that could offer at least some technical support.
Note however that anywhere below that we are in free fall territory.
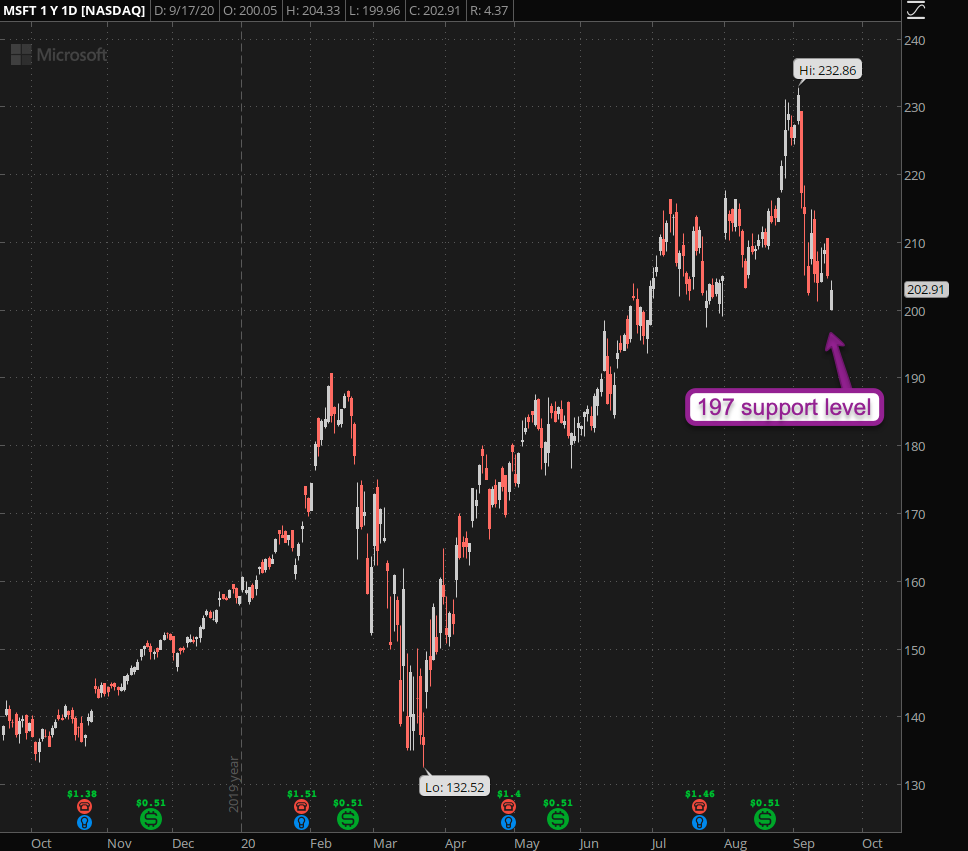
MSFT is a much easier read and I point toward 197 here as the line in the sand.
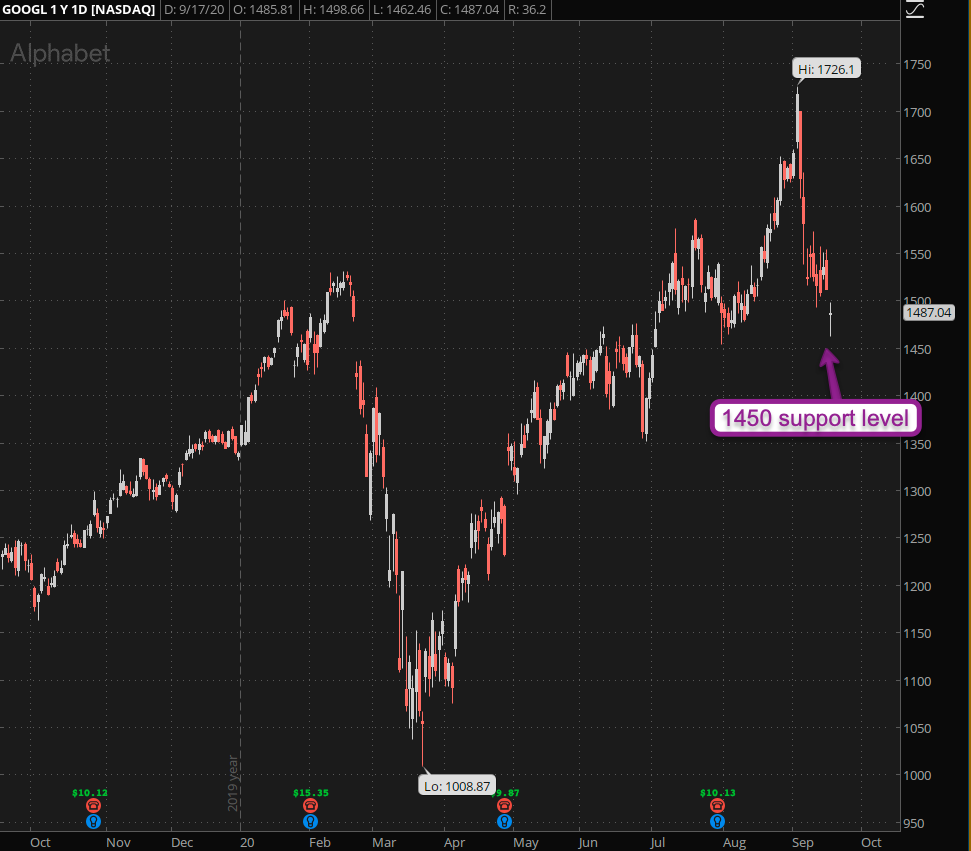
GOOGL is approaching its 1450 support level. A breach through it most likely gets us to 1400 or 1350. Not too juicy of a price but it’s worth some exposure.
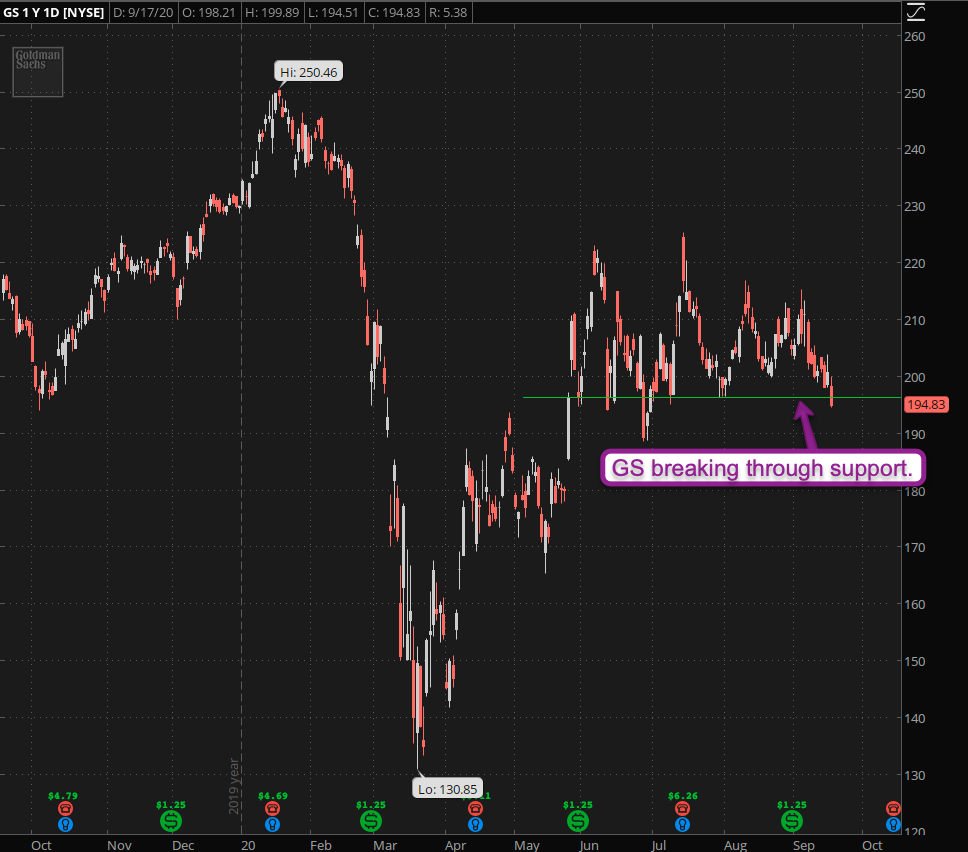
Financials have been in a world of hurt forever and I expect things to get a lot worse if the rest of the market falls apart. GS has painted an almost perfect sideways range that’s easily delineated.
195 for me is where things get dangerous and it’s currently trading below it.
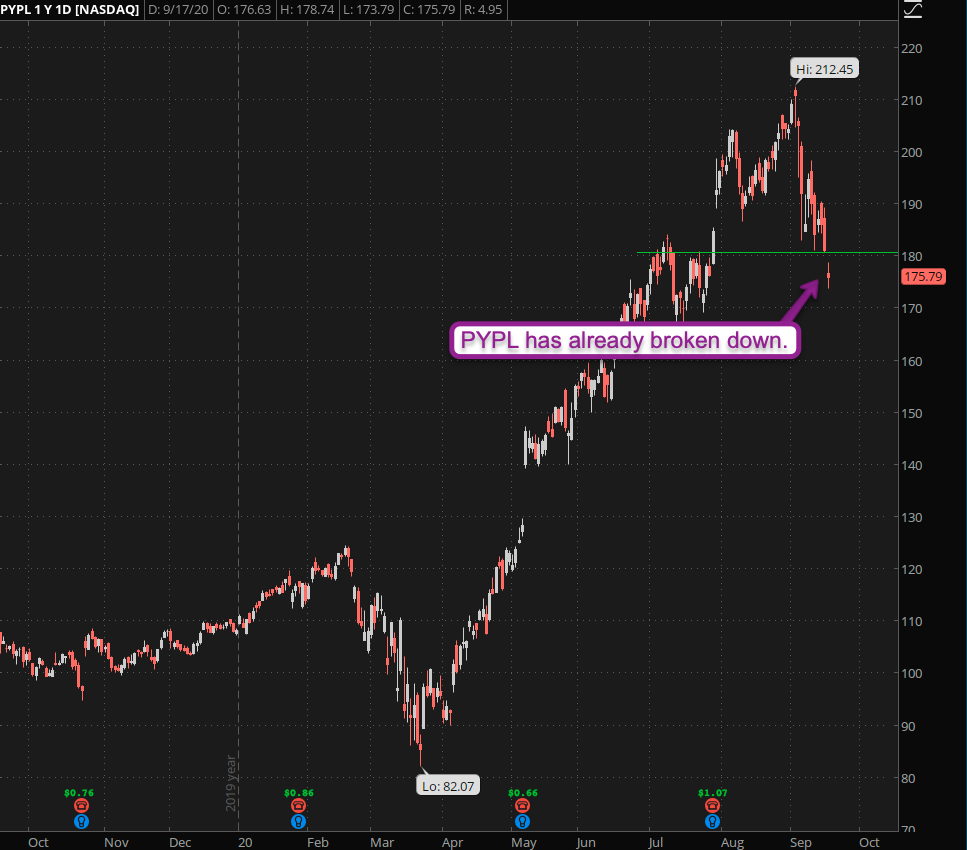
Finally PYPL – by all intents and purposes is already breaking down. So perhaps that one is our canary in the coal mine when it comes to the financial sector.
Happy hunting but don’t get overexposed, especially if you’re still new to trading. High volatility tape is difficult to navigate, so be stingy with your exposure and generous with your stops.
[/MM_Member_Decision] [MM_Member_Decision membershipId=’!(2|3)’] Please log into your RPQ membership in order to view the rest of this post. Not a member yet? Click here to learn more about how Red Pill Quants can help you advance your trading to the next level.[/MM_Member_Decision] [MM_Member_Decision isMember=’false’] Please log into your RPQ membership in order to view the rest of this post. Not a member yet? Click here to learn more about how Red Pill Quants can help you advance your trading to the next level.
[/MM_Member_Decision]


