With equities not just reaching but far exceeding stratospheric levels the question of how much longer this can be sustained obviously comes to mind. In fact it’s the prevailing sentiment in light of a face ripping rally that is unparalleled in financial history. I have repeatedly pointed out the obvious disconnect between the stock market and what has transpired across Main Street. Not just all over the United States but also in the rest of the Western hemisphere, which continues to be on the receiving end of various well intended policy decisions.
Of course Wall Street doesn’t care about Main Street, it never has and if it ever looks that way then it’s most likely a pretense or worse, a trap set for retail participants.
It’s easy to fall for this trap given that the MSM keeps insisting that economic events are linked to various gyrations in equities and other markets. This is harsh lesson that most fledgling traders are unfortunately forced to learn the hard way.
A much more effective strategy is to simply focus on what the market is DOING as opposed to what it’s TELLING you that it’s doing. Quite often the two bifurcate and not even in a subtle way. Just think back about all the nonsense you’ve heard over the past year about why the stock market was on the brink of crashing and it’ll all come into focus.
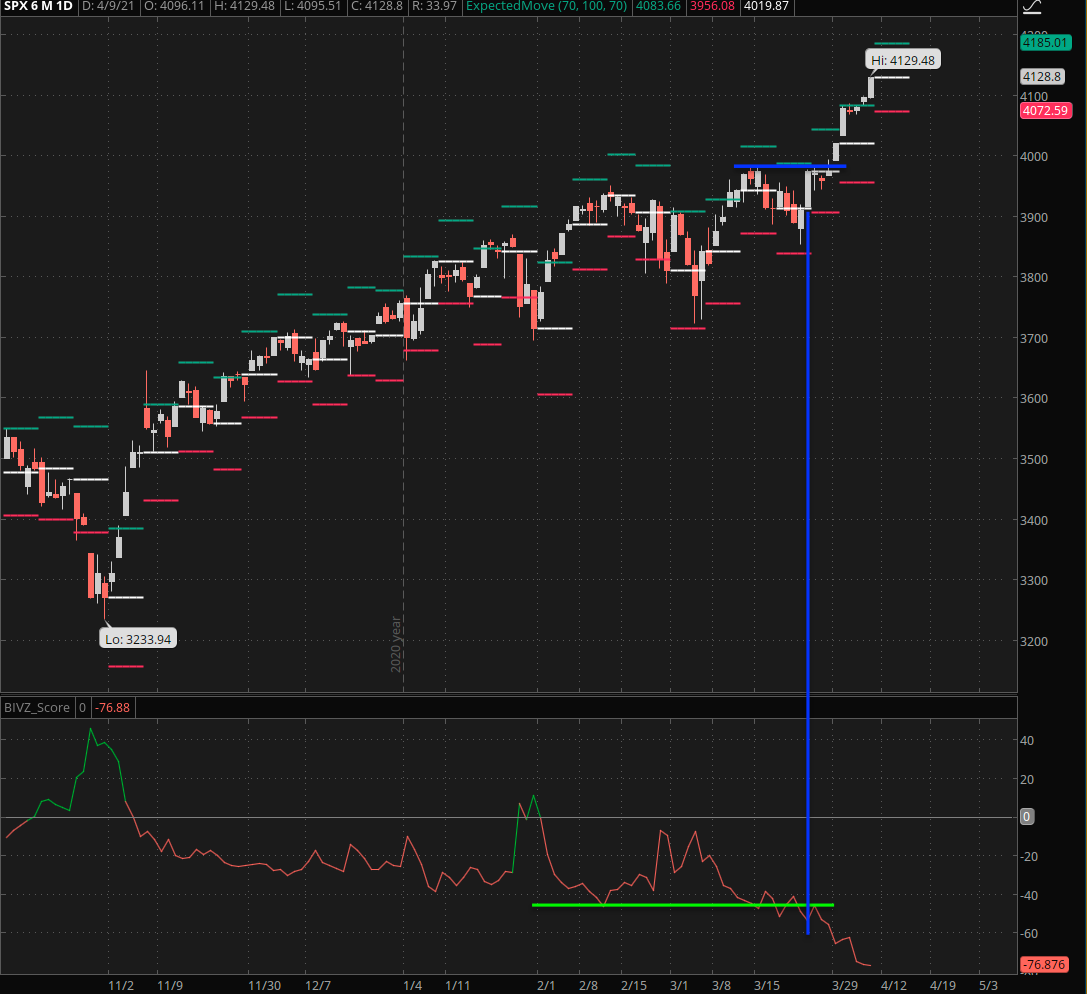
For example a distinct formation on that IVZ-Score (normalized in percentages) marks the point when the S&P got ready to make a push for that coveted 4k mark.
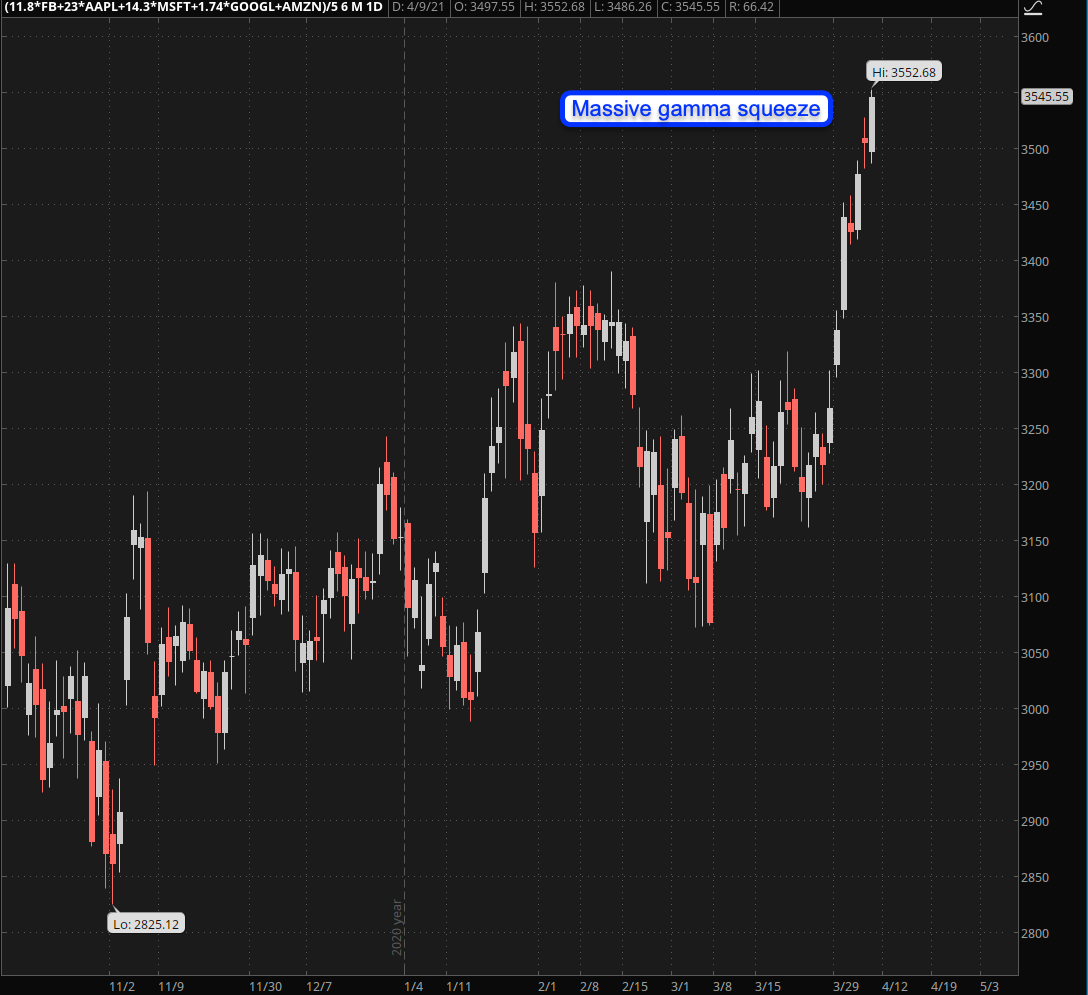
The ensuing gamma squeeze, across big tech in particular has been nothing short of biblical. And we may not be done just yet as a gamma squeeze begets an even bigger one until – finally at some point – the market runs out of buyers or shorts to squeeze.
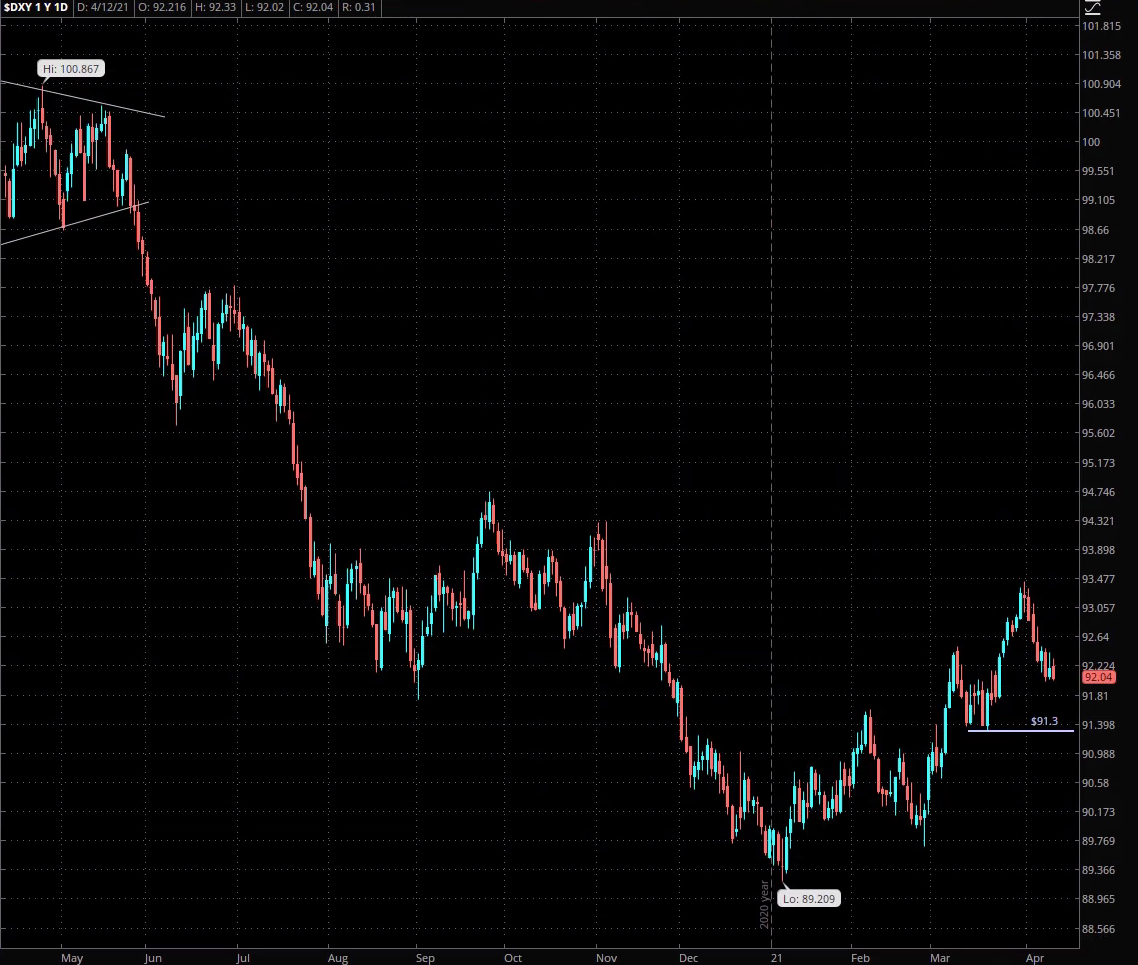
When will this party end? Well there are two charts that truly matter. One is the USD which is still figuring out whether or not it’s got sufficient mojo for a much awaited short squeeze. We are looking at a pretty convincing floor pattern here but you could have said the same back in late September of 2020.
The other is one I have been pointing at repeatedly over the past few weeks and it’s become even more acute today:
[MM_Member_Decision membershipId='(2|3)’]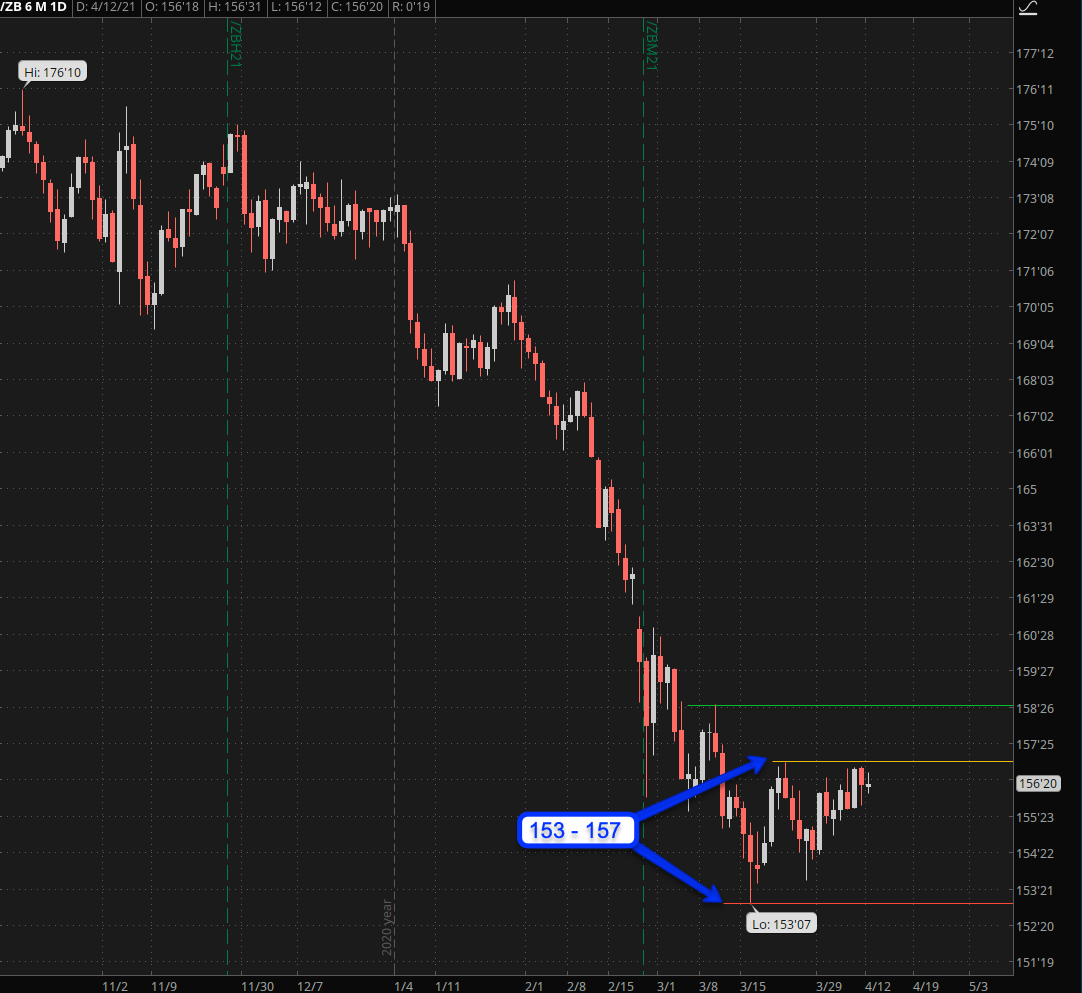
Yes bonds of course. After falling precipitously the ZB has settled into what amounts to no more than a 4 handle range. A drop below 153 and we may easily see us touching the 150 mar. However I’m not very convinced of this scenario as at some point the Fed will have to step in and put the lid on interest rates.
What I still expect to see sometime this month is a push above 157 which effectively would break the rally in equities as it would finance in particular but also to a large extend big tech, which are currently exploiting indecision in the bond market to make a run for ever loftier heights.
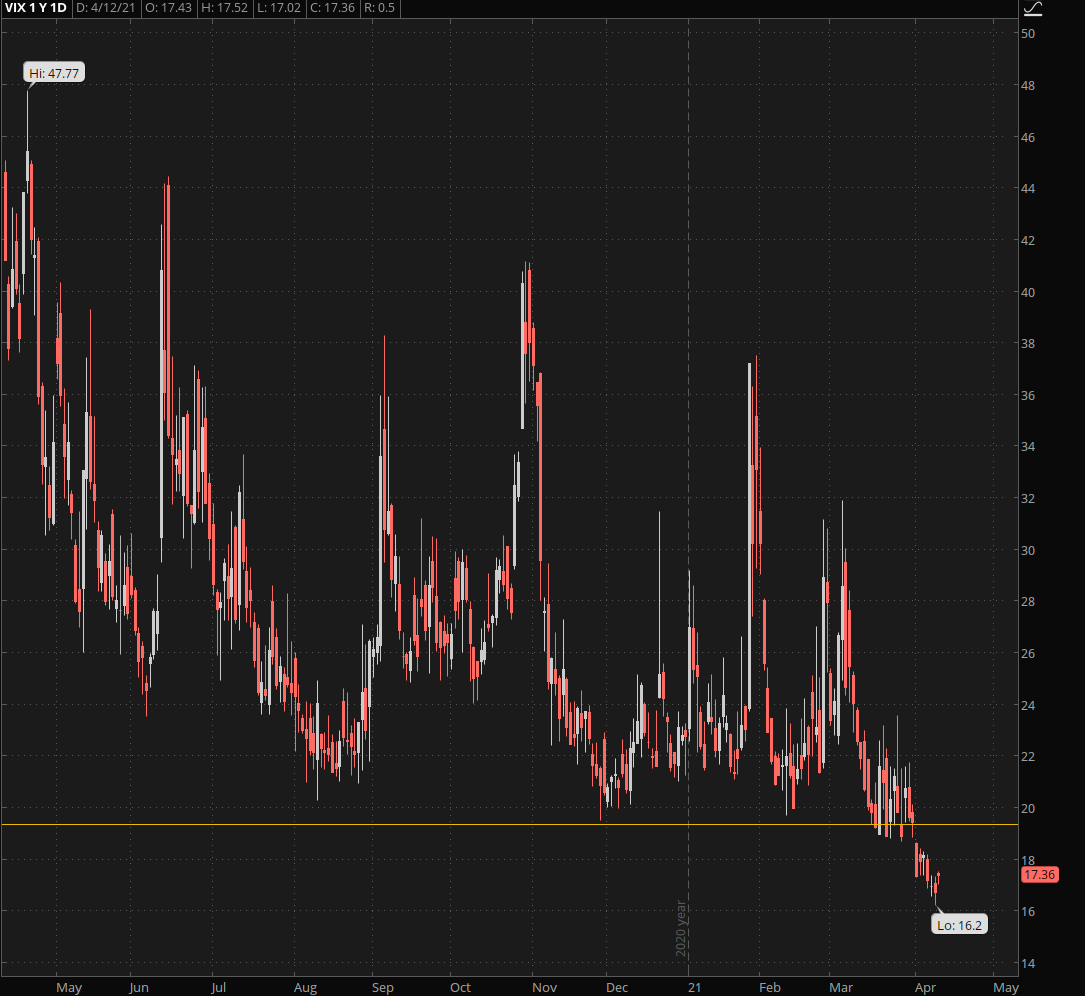
In terms of how to approach this week from a trading perspective there are two considerations. One is the VIX which is now pushing 16 and although I could easily see it at 15 it’s bound to paint a floor here soon. Which effectively makes me long implied volatility.
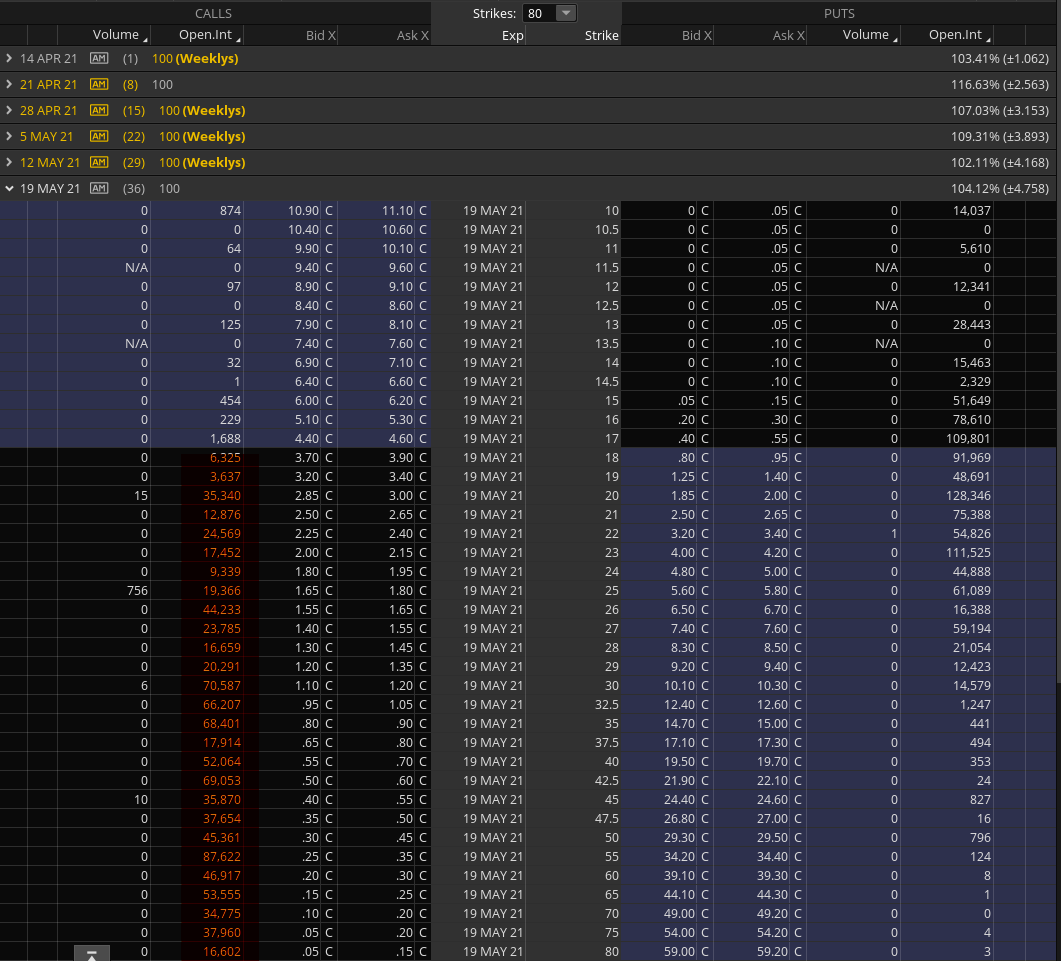
So we are talking CYA spreads in equities as well as OTM spreads in the VIX. FYI – check out the May or June open interest in OTM calls which will blow your mind. Now it’s possible that this is merely hedging activity to reduce gamma and vega risk, but frankly speaking I don’t think that is the case.
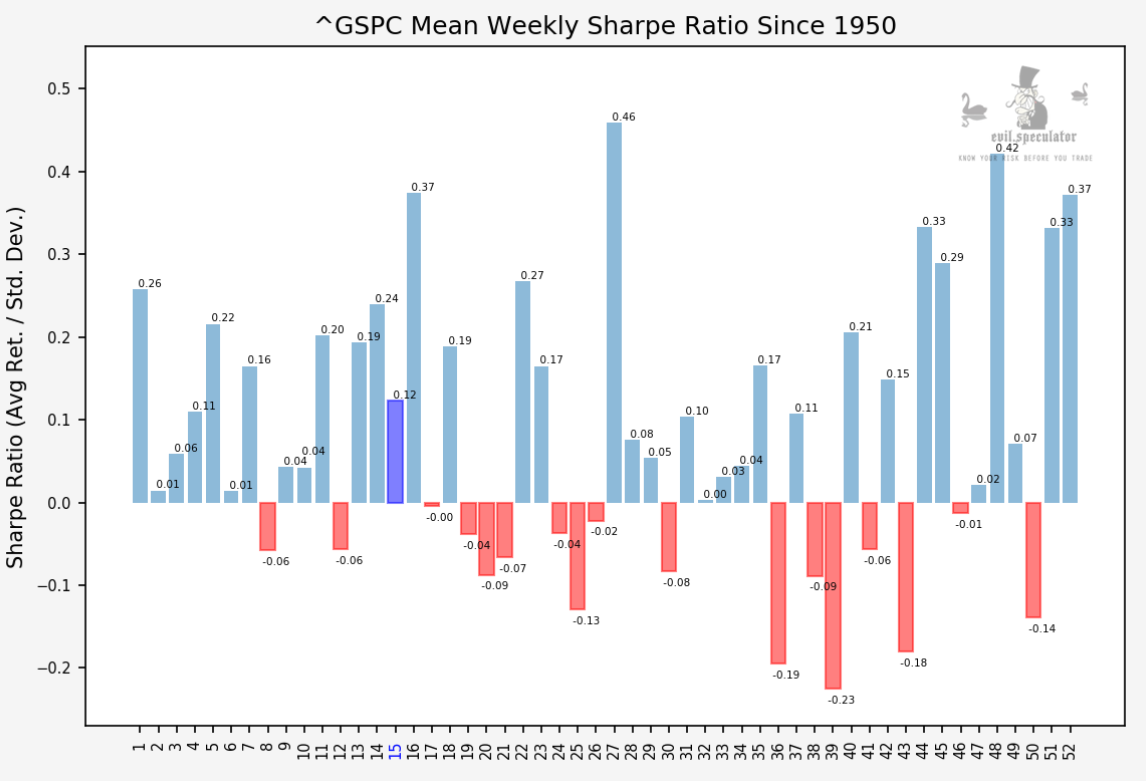
Stats for this week: Sharpe is looking good but not spectactular.
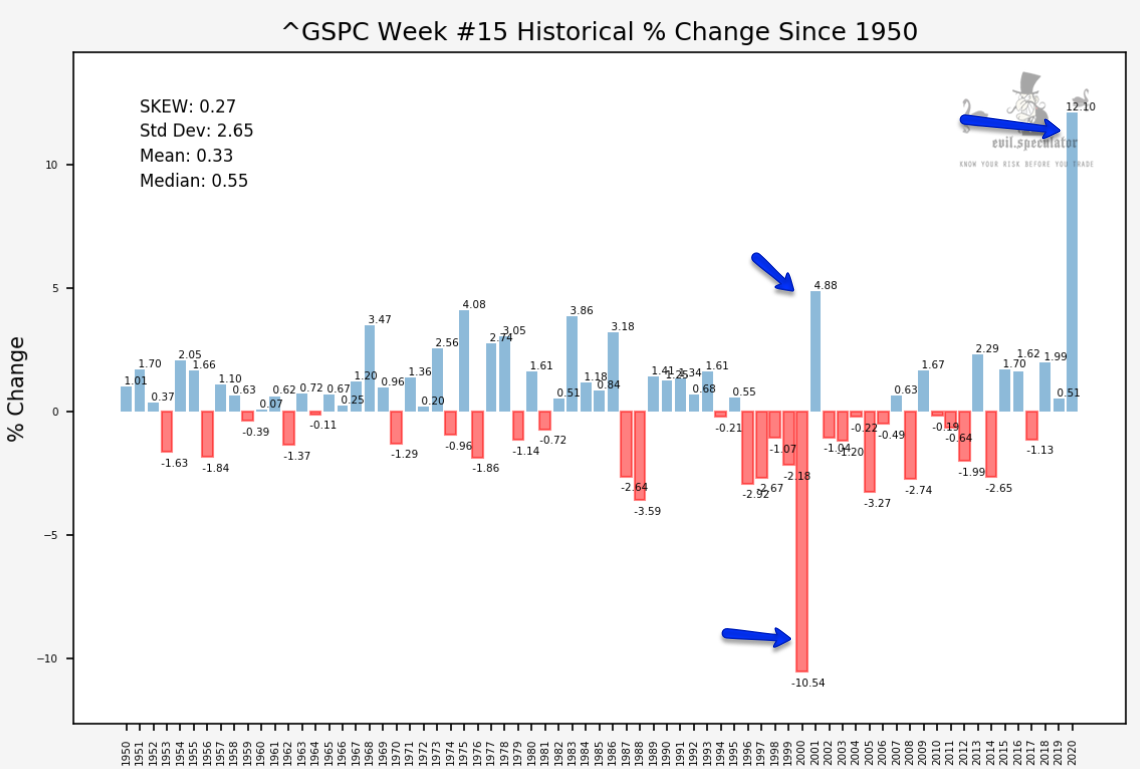
Historical percent gives you an idea what has happened in the past during week #15. Quite some spikes there but we are just coming out of a big move so IF we get a biggy my money is on a counter move.
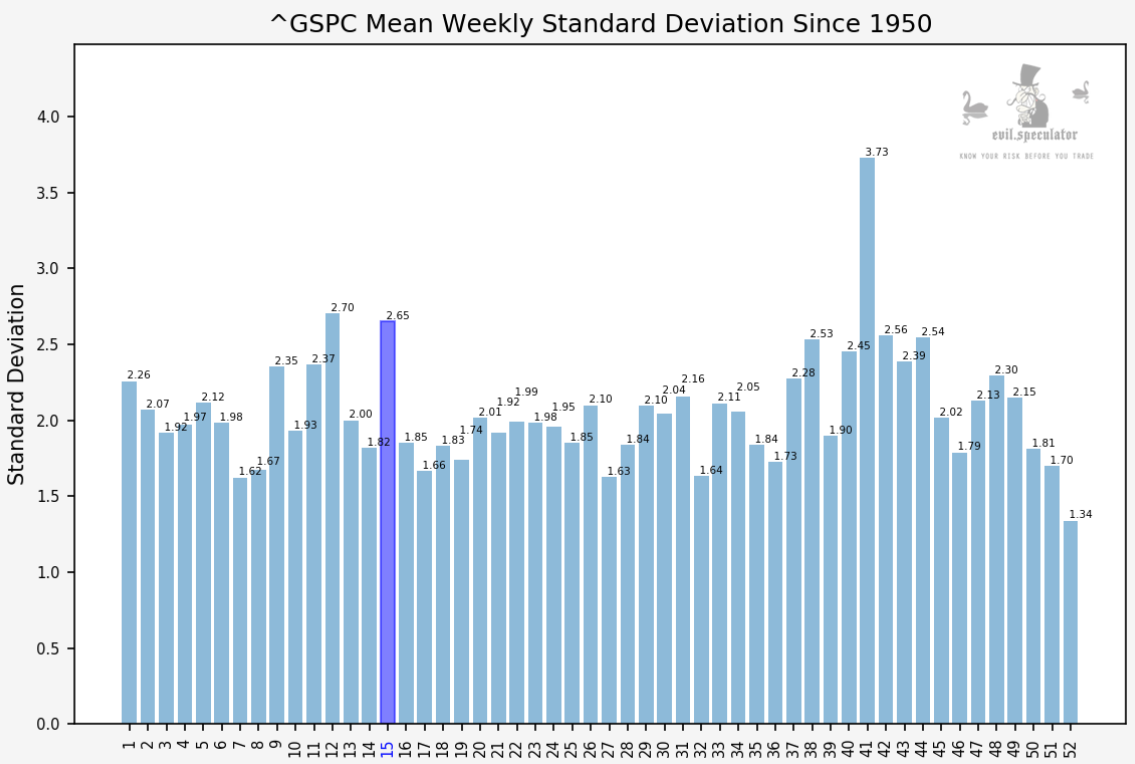
Standard deviation is elevated for the season – in fact the widest range all the way into fall. Keep that in mind when placing your BFs this week or when setting your stops as things could swing more wildly than the current EM range suggests. Remember the EM range is based on probability of closing and not on probability of touching.
Happy hunting but keep it frosty.
[/MM_Member_Decision] [MM_Member_Decision membershipId=’!(2|3)’] Please log into your RPQ membership in order to view the rest of this post. Not a member yet? Click here to learn more about how Red Pill Quants can help you advance your trading to the next level.[/MM_Member_Decision] [MM_Member_Decision isMember=’false’] Please log into your RPQ membership in order to view the rest of this post. Not a member yet? Click here to learn more about how Red Pill Quants can help you advance your trading to the next level.
[/MM_Member_Decision]


