The market seems to be going through a manic depressive phase right now which is increasingly affecting its ability to handicap risk. This was to be expected to some extent given the turbulent times we live in. But there’s a lot more to this and in essence it all boils down to the growing contrast between two clashing world views, with Wall Street apparently ready to go back to business as usual while Main Street finds itself mired in a political cold war that may extend far beyond January 20th and the inauguration of the 46th president of the United States.
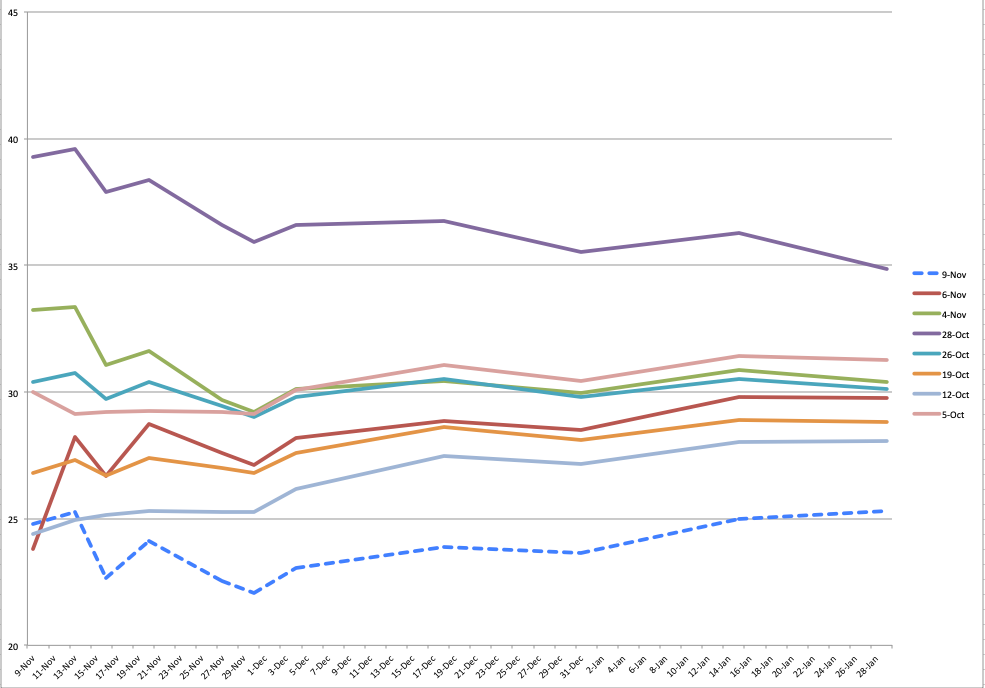
I’ve been posting this graph throughout the past month and it’s been a very worthwhile exercise as it does a bang job of visualizing the propagation of market sentiment throughout the tail end of the presidential election season. Which by all intents and purposes has not concluded yet as the final results have not been certifiied.
The dotted line shows us the current situation which clearly depicts a massive drop of IV all across the board. And that’s usually all we are concerned with. I mean how many of us actually plot the propagation of sentiment across the SPX chain on an ongoing basis? Only nutcases like yours truly obsessed with volatility perhaps and even for me this is a first.
This type of data is usually very difficult to acquire and to plot, which is why everyone basically adopts the collective long term memory of a housefly. But looking at the graph above makes it clear what the market as a whole thought about the elections ahead of the big day and thereafter.
Which stands in stark contrast with most of what I’m seeing across Internet forums, blogs, social media, and the mainstream media – all of which are still in scorched earth battle mode with no end in sight. And I’ve got to ask myself – as a citizen as well as a trader – who’s got it right here?
Clearly the market thinks that we’ve got a president-elect and that it’s time to move on. Main street on the other hand is gearing up for a protracted political war that may end up in more violence and ideological brinksmanship. As a citizen I cannot answer that question to be honest as I’m not the predicting type and at this point pretty much anything can happen. If nothing else 2020 has been a textbook case for my hypothesis that attempting to predict the future is a fool’s errand.
But as a trader I cannot help but worry that Wall Street may either be getting a bit ahead of itself or perhaps may be setting a major trap for the bulls. Let me show you why:
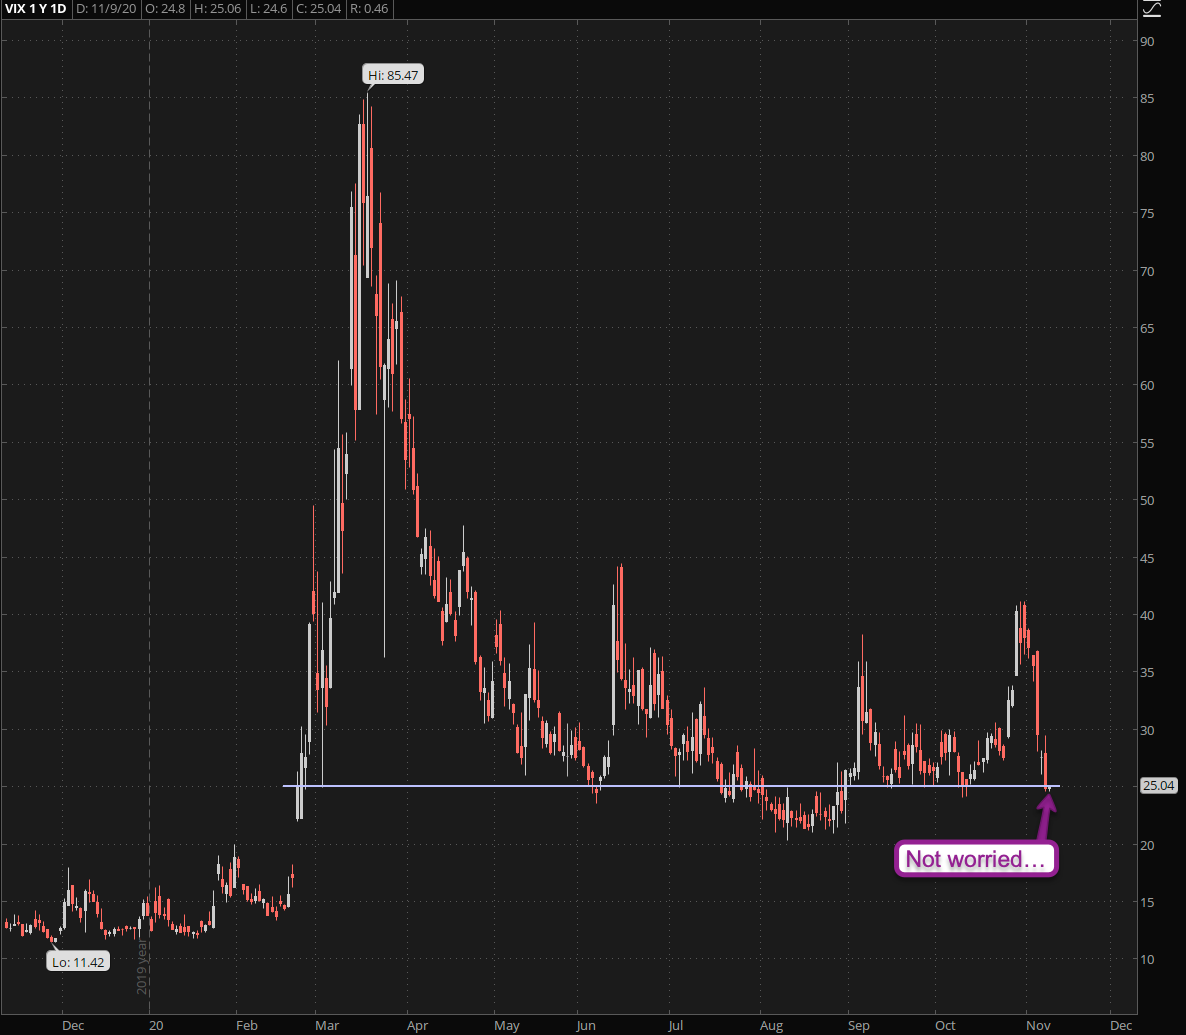
The VIX is back at its current baseline near 25. A breach below is of course possible but unless the election debacle resolve decisively in the very near term future I think we’re getting pretty close to the bottom of the barrel on the IV front.
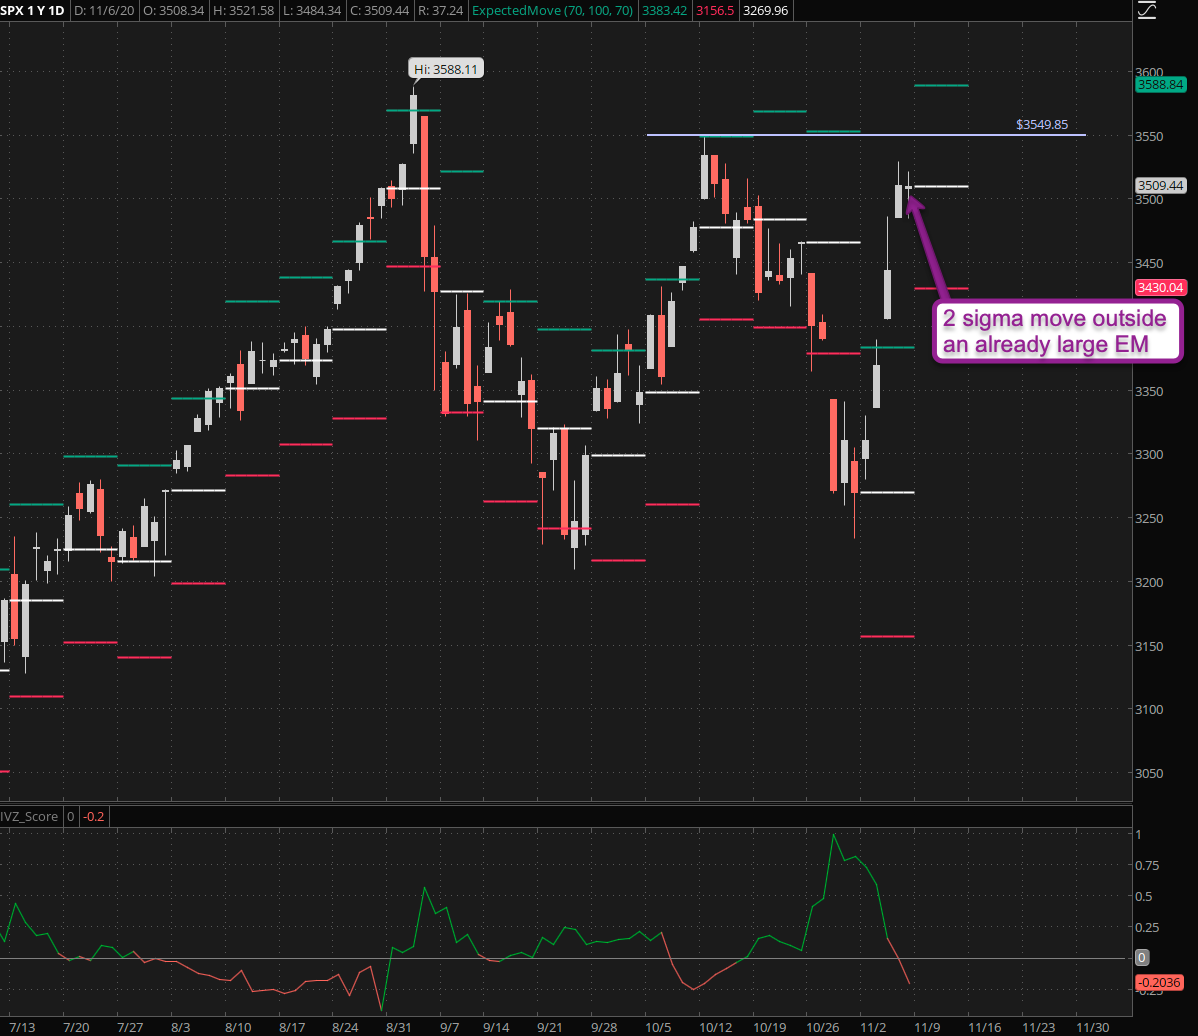
Which is interesting given that the SPX has been busting through its weekly expected move several times over the past few weeks. In fact in week #45 (last week) the weekly EM was tagged about 160 SPX handles – we ended up pushing twice as much.
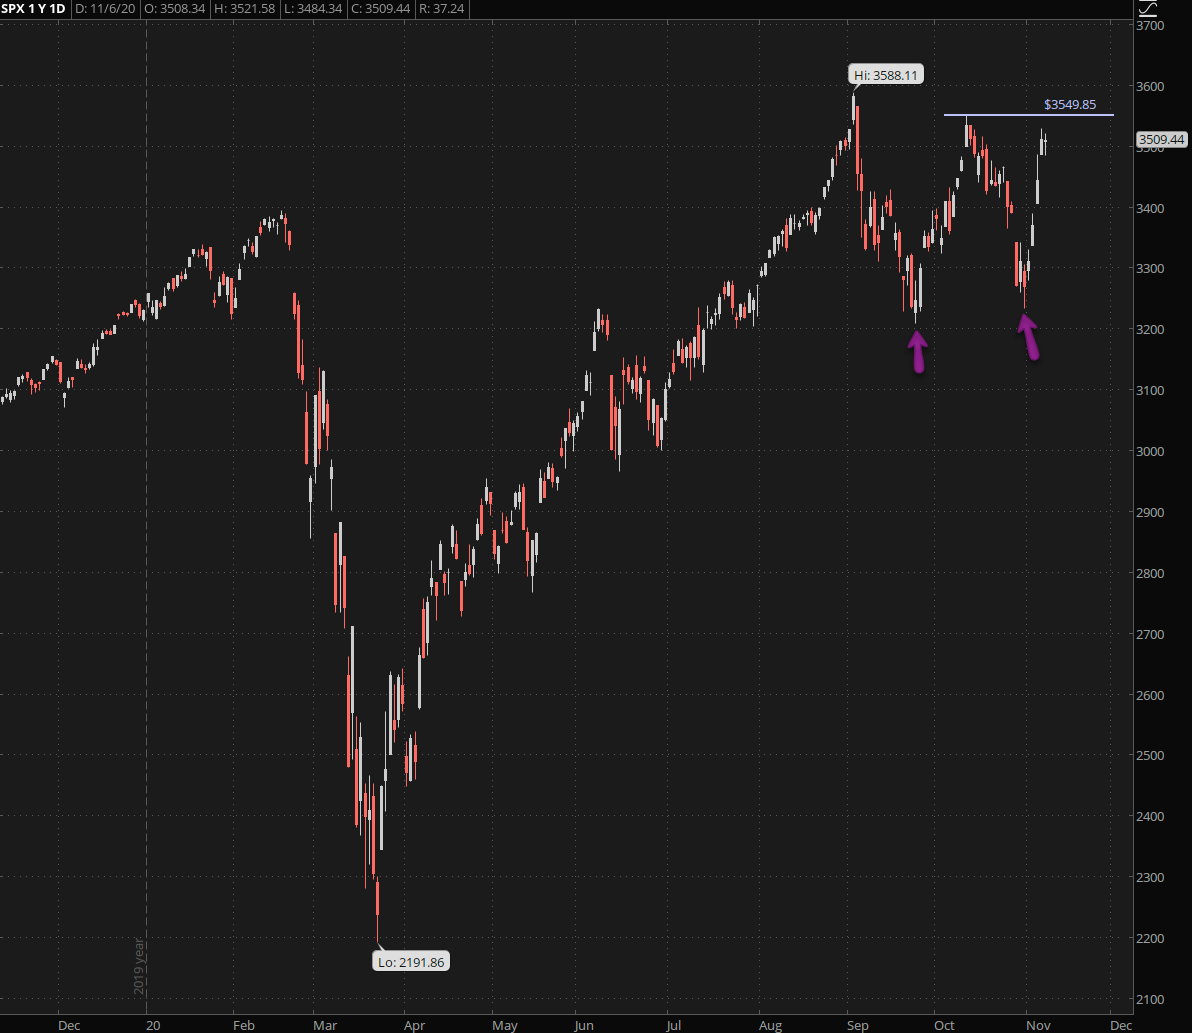
Which incidentally is getting us back to a possible triple top double bottom type of conundrum. Is it a bull trap? Well, we’ll know pretty soon as a push above SPX 3600 probably resolves this formation (to the upside). So not a bad spot for a bit of downside protection or pertinent speculation, if you get my drift. IV after all is relatively cheap right now.
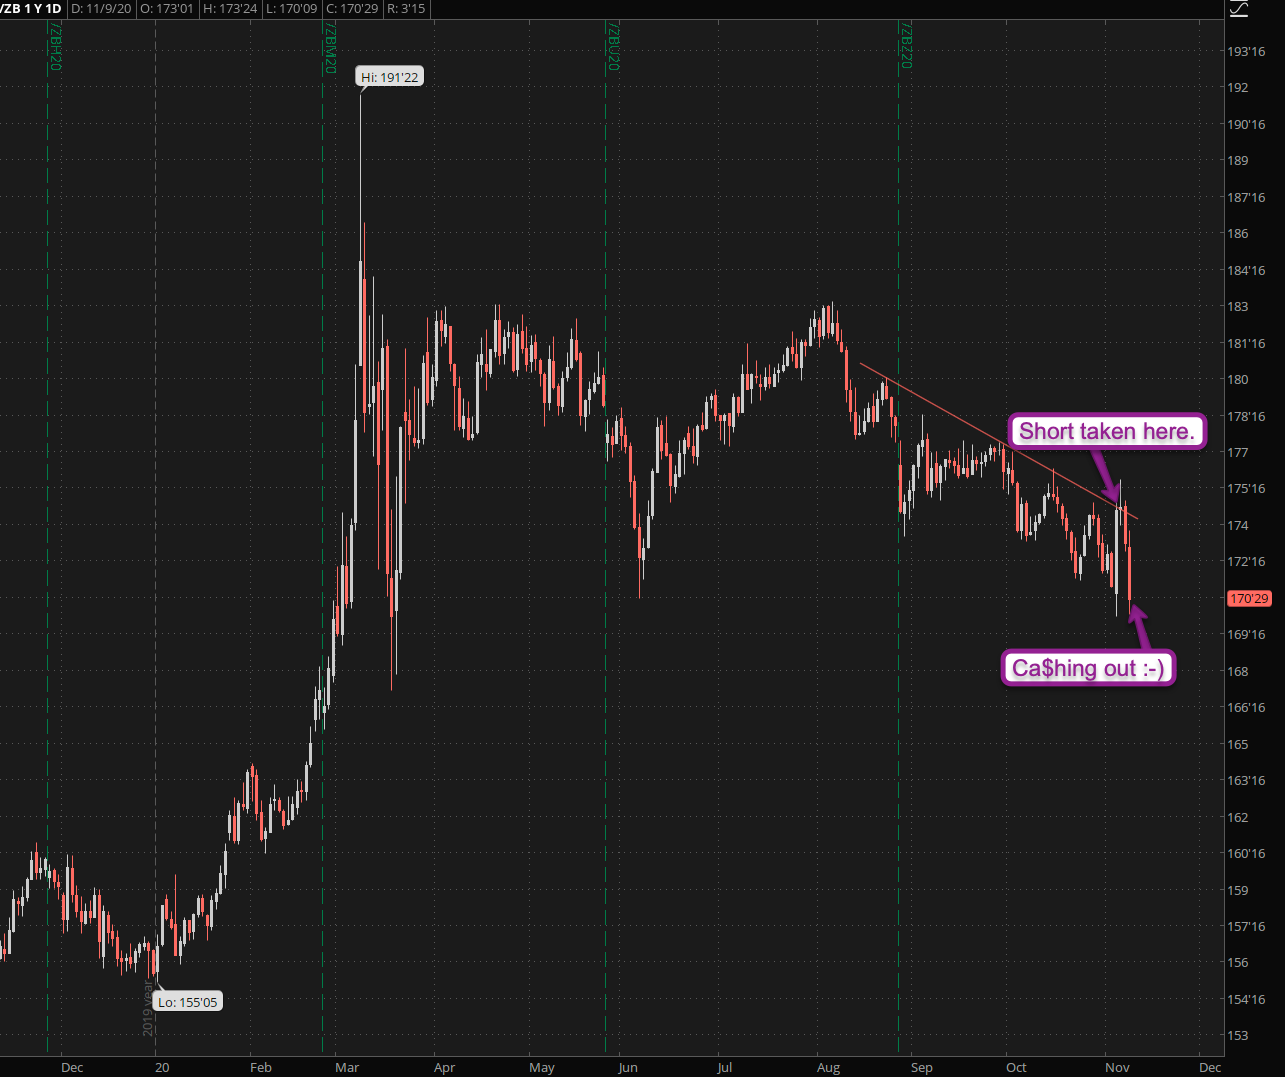
Speaking of downside speculation – the bond short play I suggested last week played out perfectly and I’m going to be taking ample profits here.
But from a general market perspective this suggests the market is pushing back into riskier assets post election, assuming court challenges and other legal maneuvers will amount to nothing, and that Biden is on track to be sworn in on January 20th. If that scenario disturbs you then please don’t shoot the messenger – I’m merely reporting on what I’m seeing in the market.
But wait there’s more… please meet me in the lair for an update on what lies ahead in regard to market volatility – as well as the weekly stats:
[am4show have=’p1;p13;p9;p12;p5;p10;p20;p29;p32′ guest_error=’login’]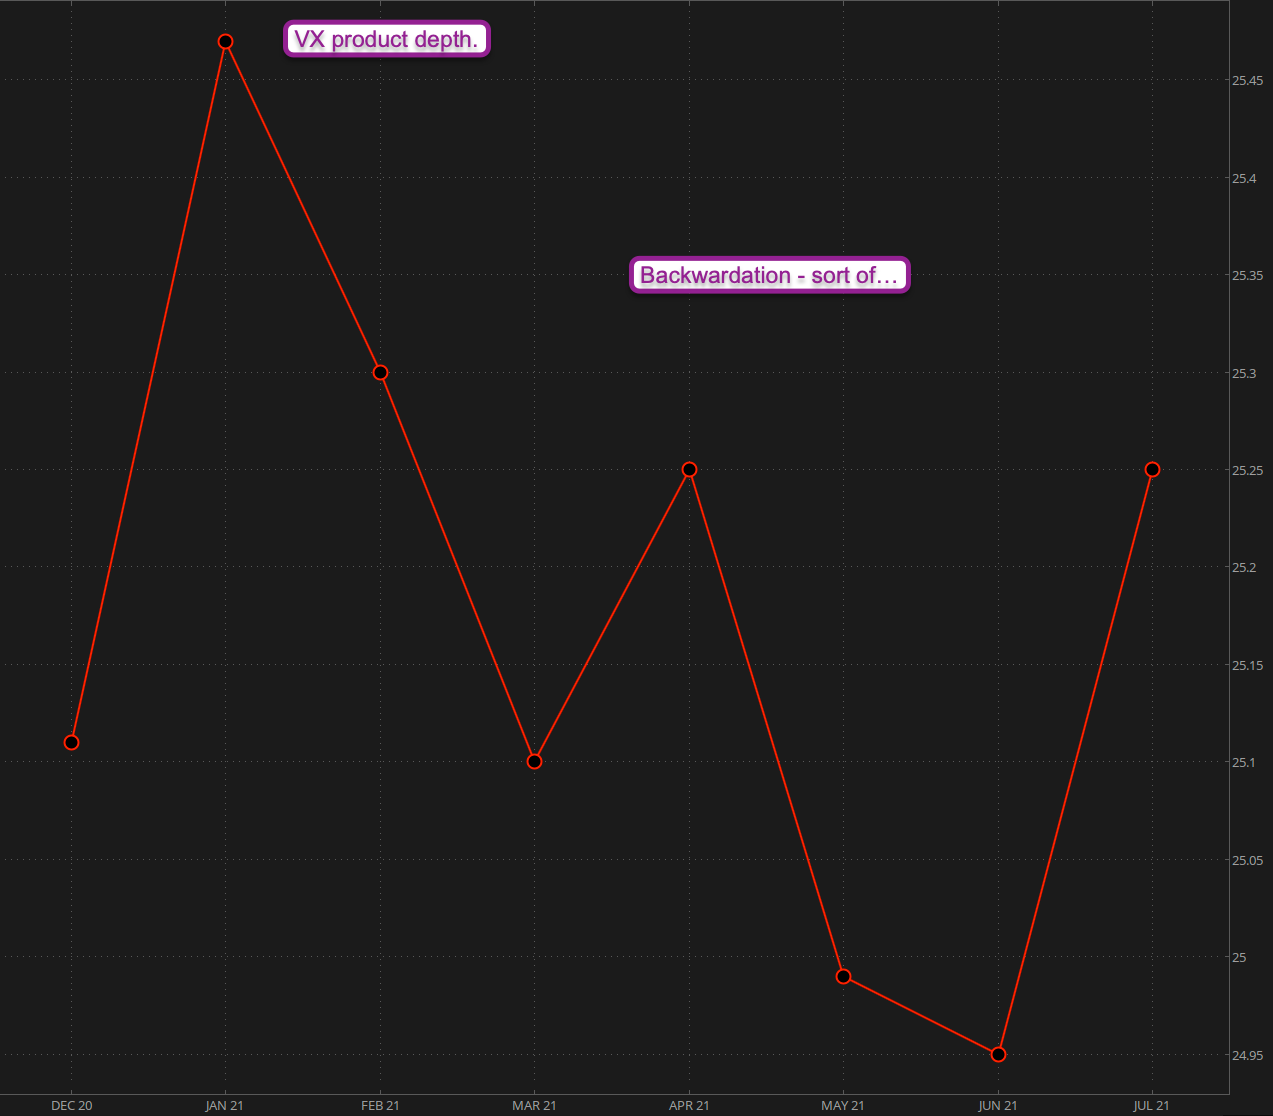
Jumping back into implied volatility – I simply didn’t want to share it with the leeches 😉
And it’s looking extremely strange right now, meaning relatively low IV for December with a steep increase for January. Not sure what the expectation here is. One explanation may be that the market expects a quiet December while the courts challenges go through their constitutional motions. Which then may be followed by public unrest later in January.
That’s just a theory but something must account for the strange formation we are currently seeing all the way into early spring. Why we would see an IV spike in April of all months (one of the year’s best performers for equities) is beyond me.
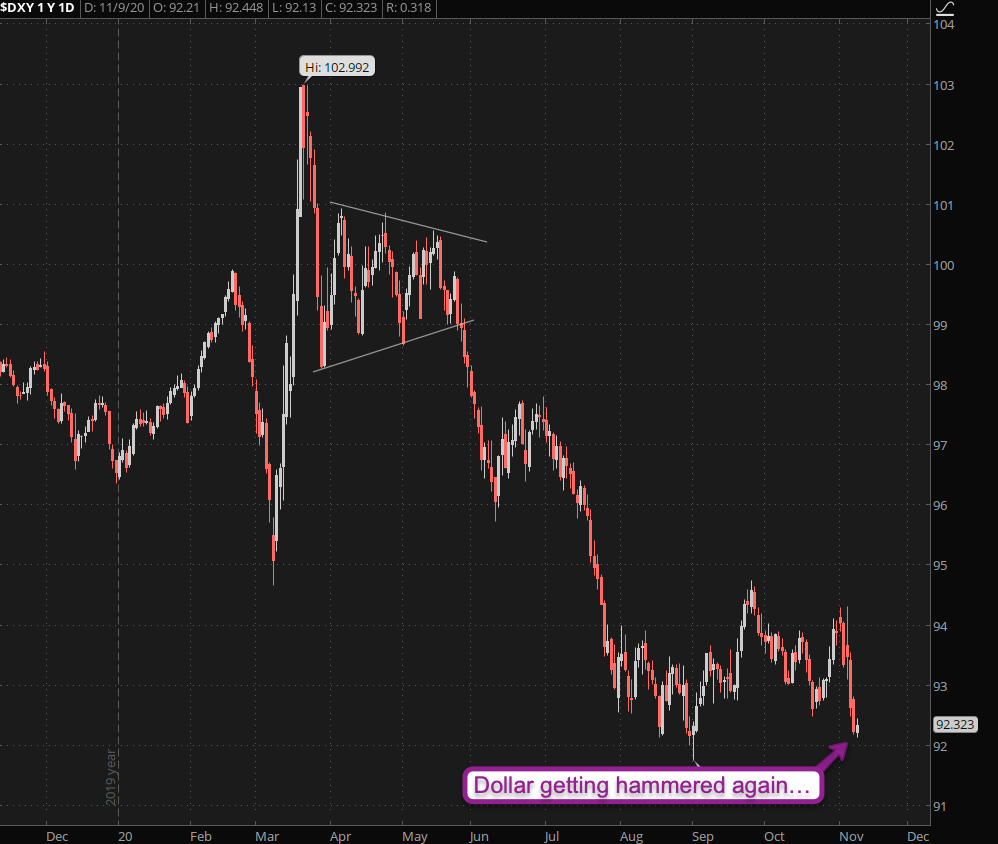
While all this plays out the Dollar continues to ge pounded. Told ya that the prospect of a Biden win wouldn’t be bullish for the greenback either, not sure what is at this point.
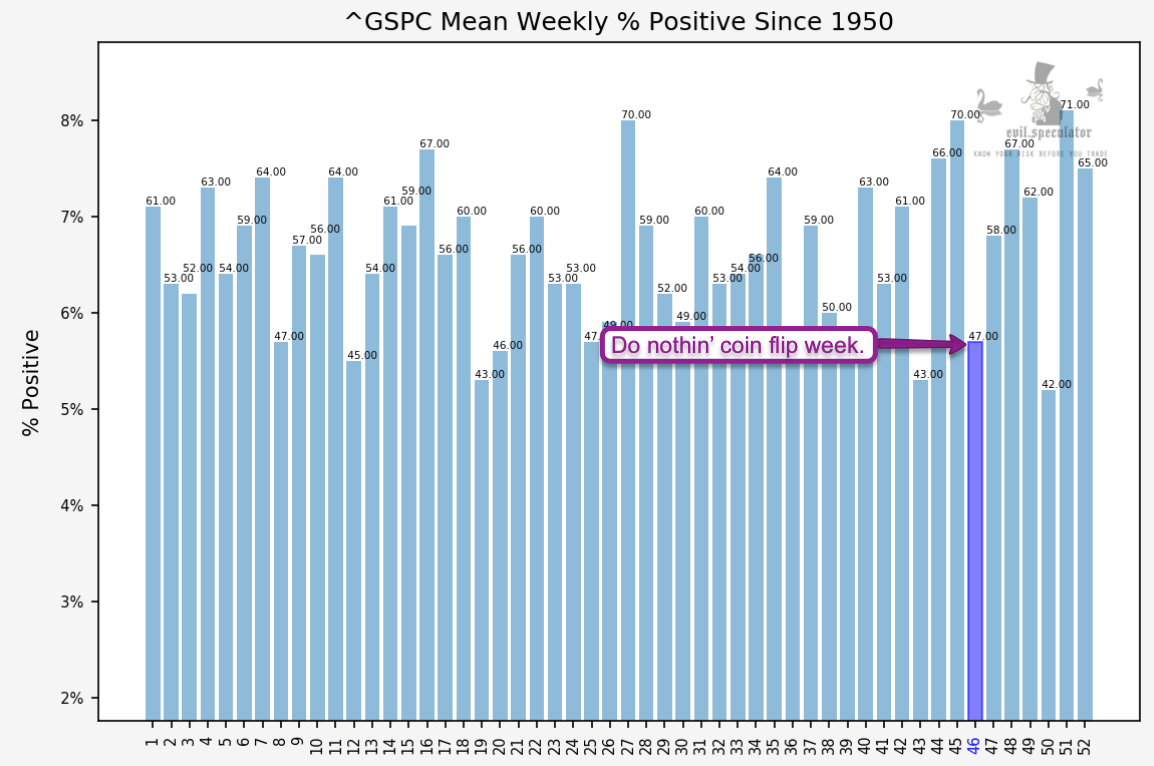
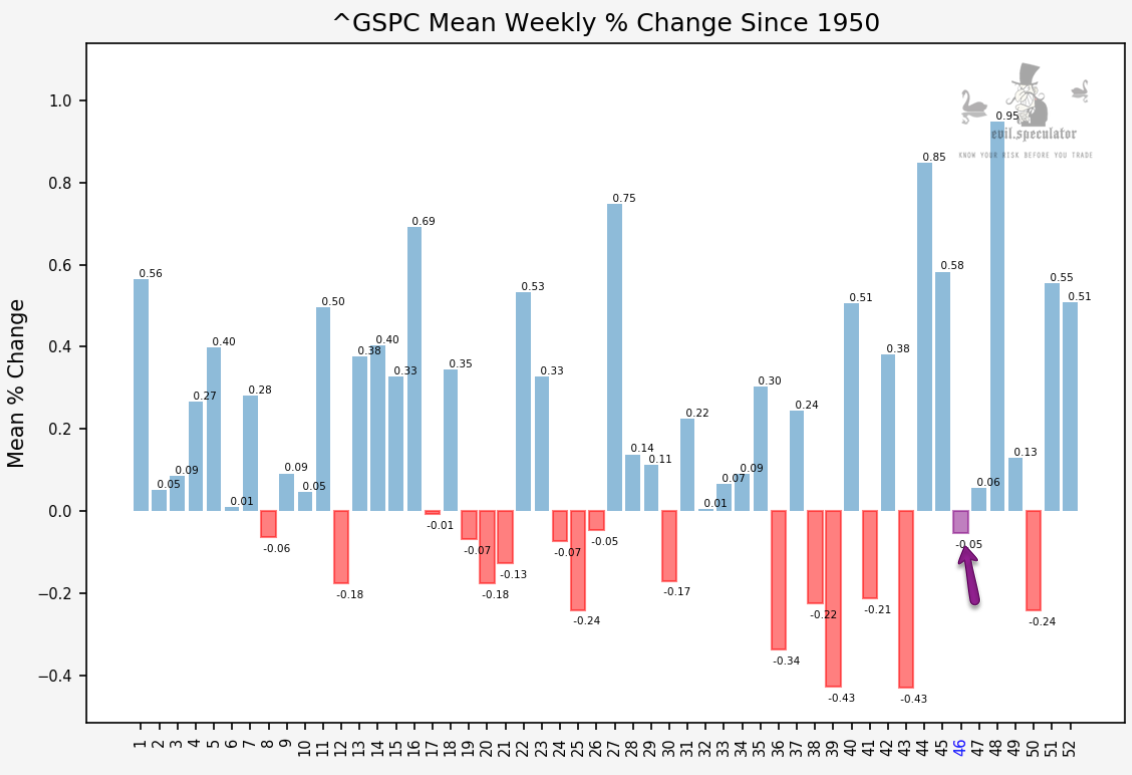
In terms of statistics we’re looking at a possible sideways churn week here. Weekly percent positive ranked a 47 which is in the lower range. Which would also make a lot of sense after last week’s massive advance. Ramp & camp, baby!
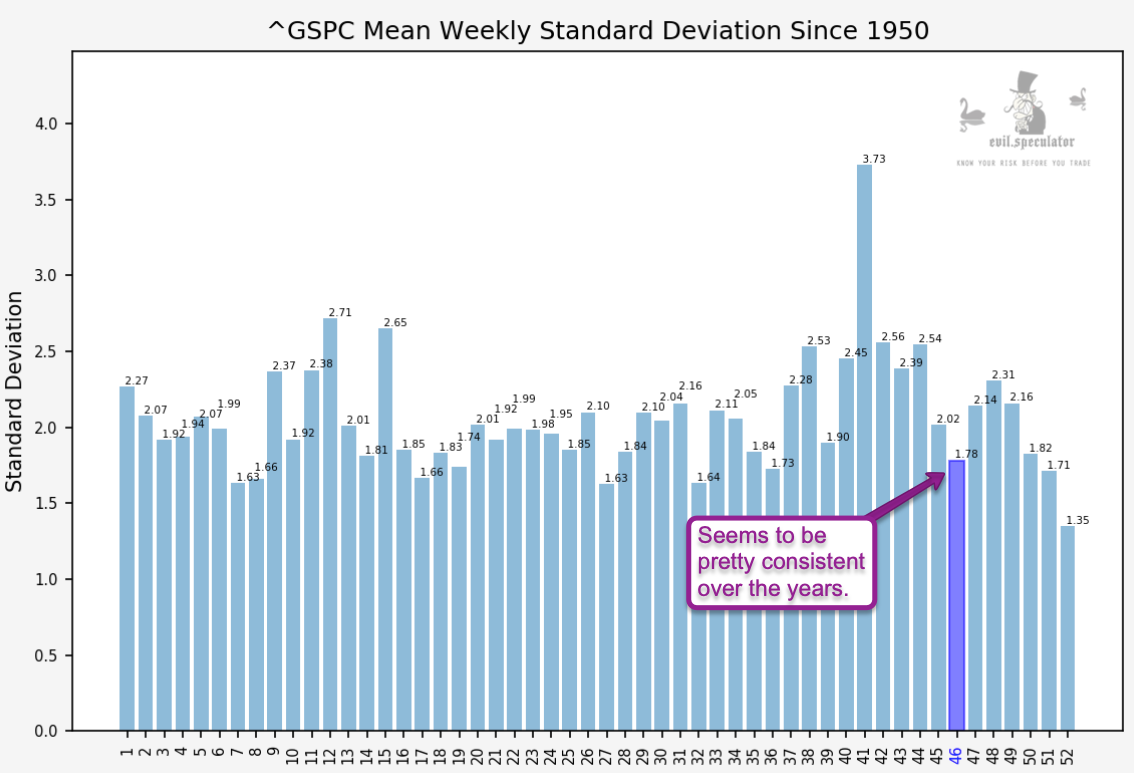
Standard deviation for week # 46 is also pretty low – but not shown here is the actual break down which shows more variation over the past few years. So let’s not get complacent either, shall we?
Percent change is pretty much a coin toss at -.05 – clearly week #46 is historically the weakest of November.
Bottom Line
Not a week for big moves and directional outliers, so plan your trades accordingly. I personally plan to take out a few lottery ticket OTM puts while the IV getting is good, as well as some gamma iron condors, perhaps my beloved hammock spread (i.e. fat put butterfly in combo with a call back ratio).
Happy hunting but keep it frosty.
[/am4show]

