With summer and the dreaded vacation season finally behind us I am already looking forward to the wild swings the fall and winter seasons may have in store for us. For volatility opens the door to juicy trading opportunities and that’s what we’re all about here at Red Pill Quants.
While monthly statistics may sound boring to some of you it’s hard to argue the fact that September played out exactly as suggested simply based on seasonal precedence.
Of course a directional bias doesn’t mean the price action is chiseled in stone, but as the saying goes: The race is not always to the swift, nor the battle to the strong, but that is the way to bet.
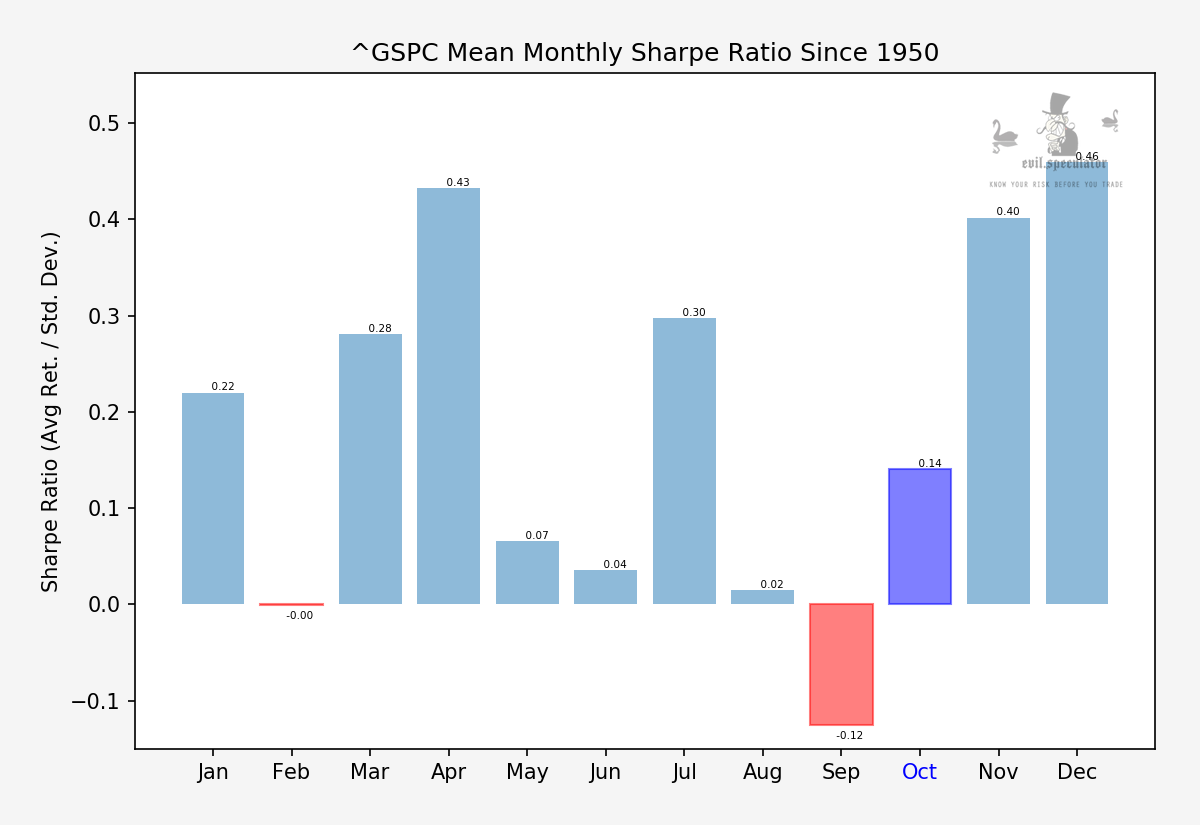
At first sight October isn’t much to write home about. In fact it trails as the sixth weakest month of the year right after May.
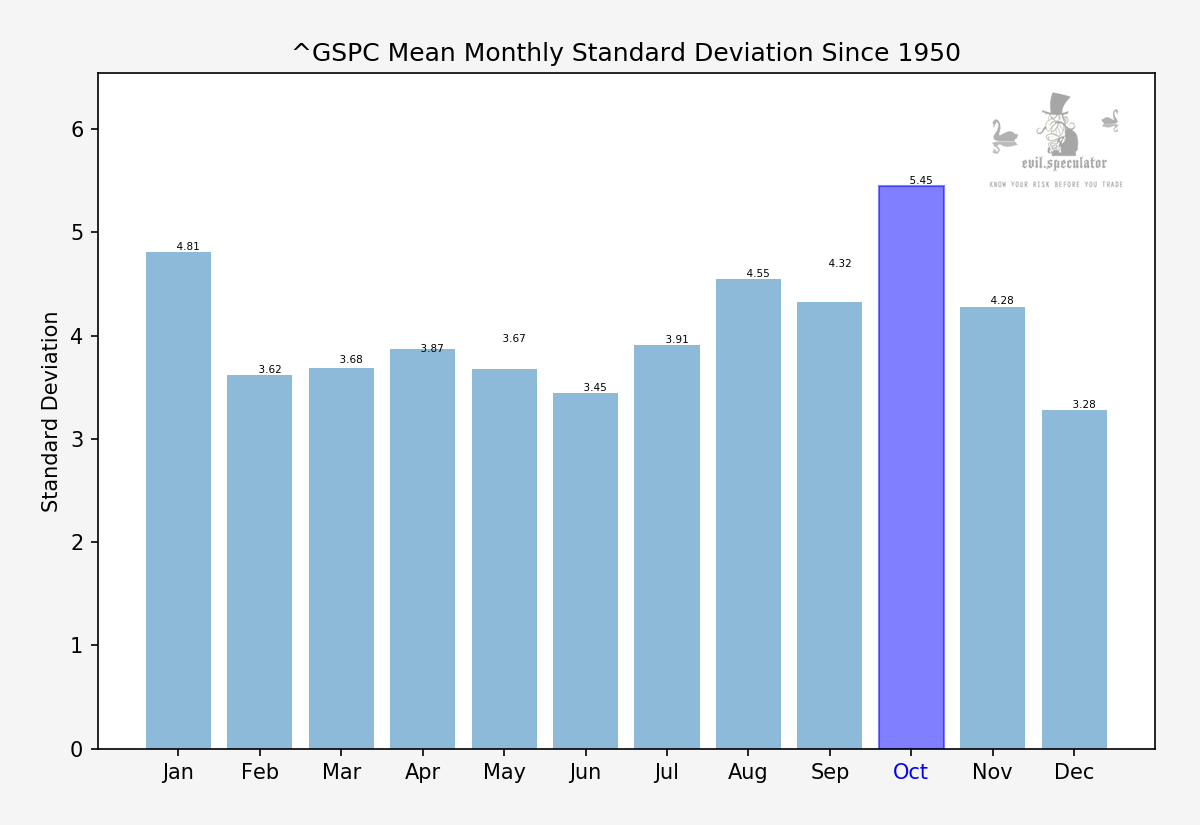
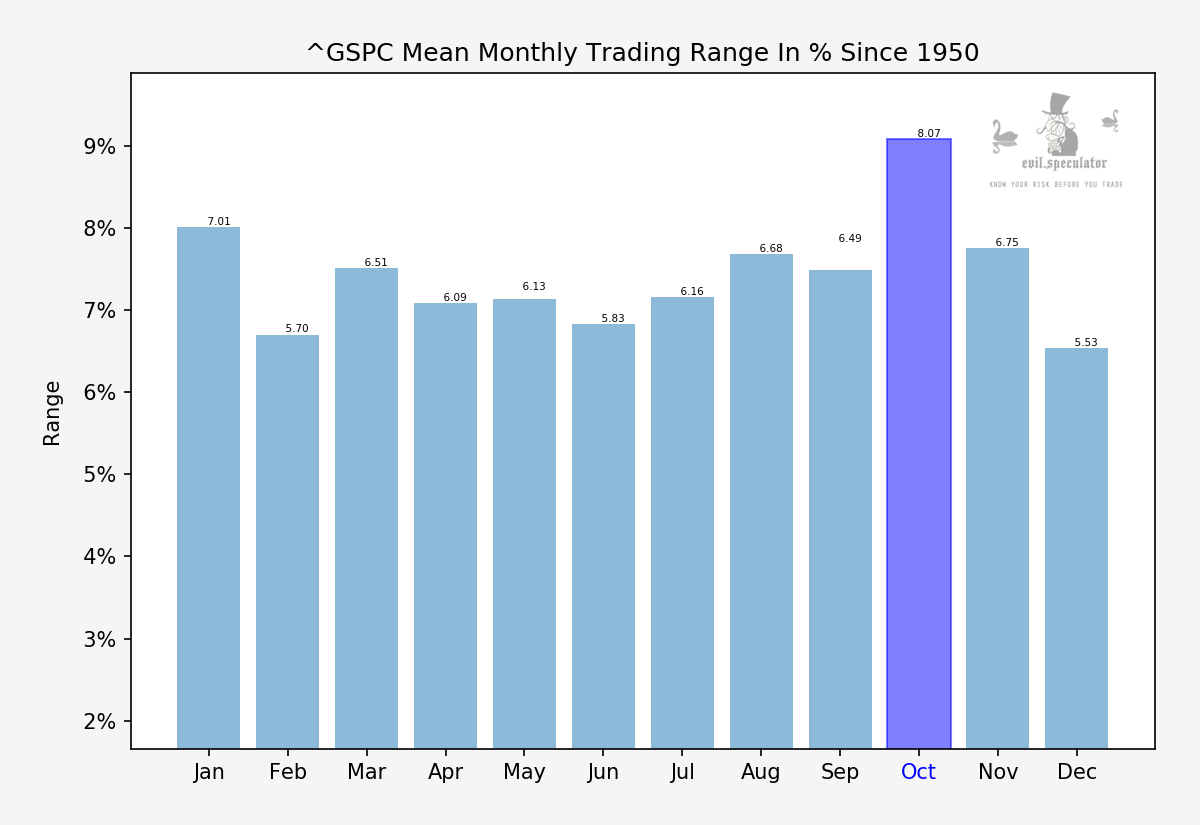
It’s also not an easy month to be active as standard deviation is on the increase. Despite being the sixth weakest month of the year October leads in terms of standard deviation.
It’s a period of transition – in many respects – and we should expect some wild swings in the coming weeks.
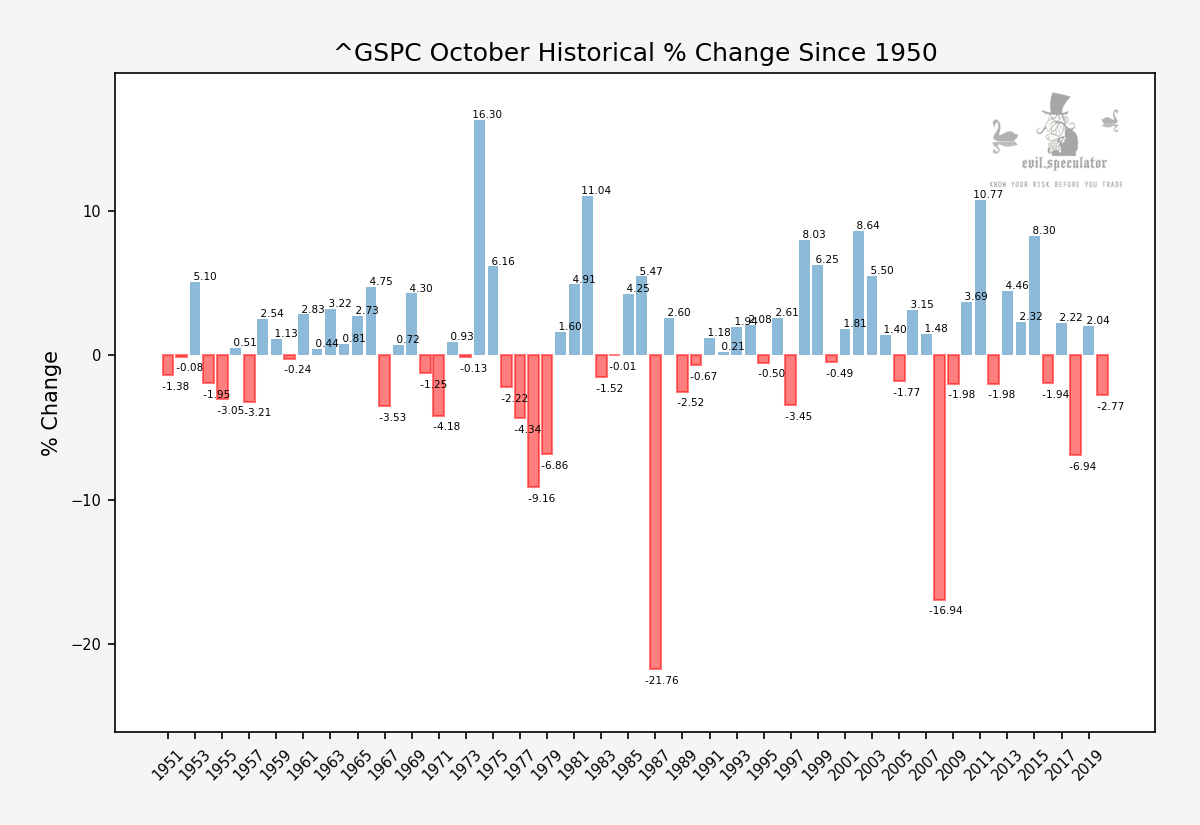
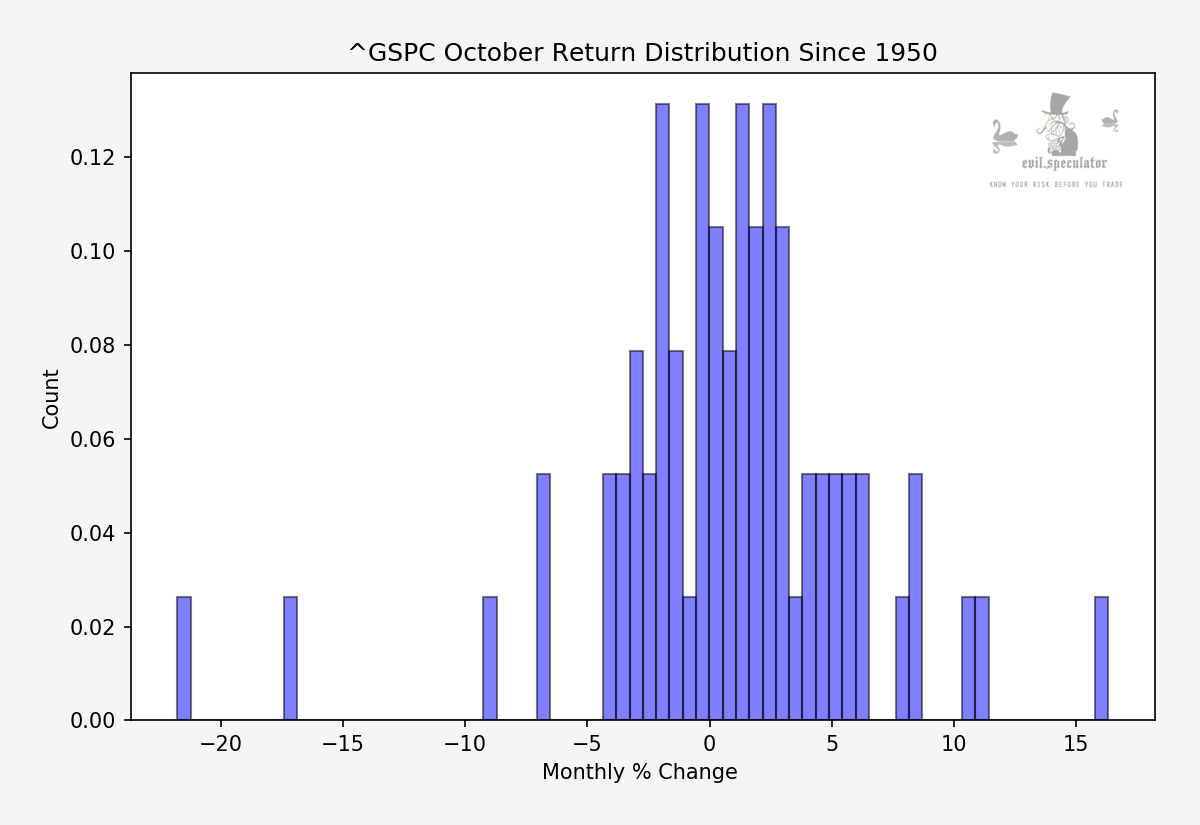
This graph shows us every single October since 1950, so 60 years of price action. Even at a cursory glance it becomes clear that downside months occupy a little under half the dataset – 27 out of 60 (I did count 1984 as a break/even).
Which brings us to 45% negative which on its surface is fine. However we do see several outliers which suggest that when things go bad in October they REALLY go bad.
And that right there is the underlying reason for October’s lousy reputation especially among seasoned traders. If you’ve been around for more than 10 years you will most likely have seen a big October surprise and unless you traded back in the 70s it was most likely to the downside.
The histogram of all those returns paints a pretty clear picture. October could have been a pretty regular month but the outliers really spoil its reputation.
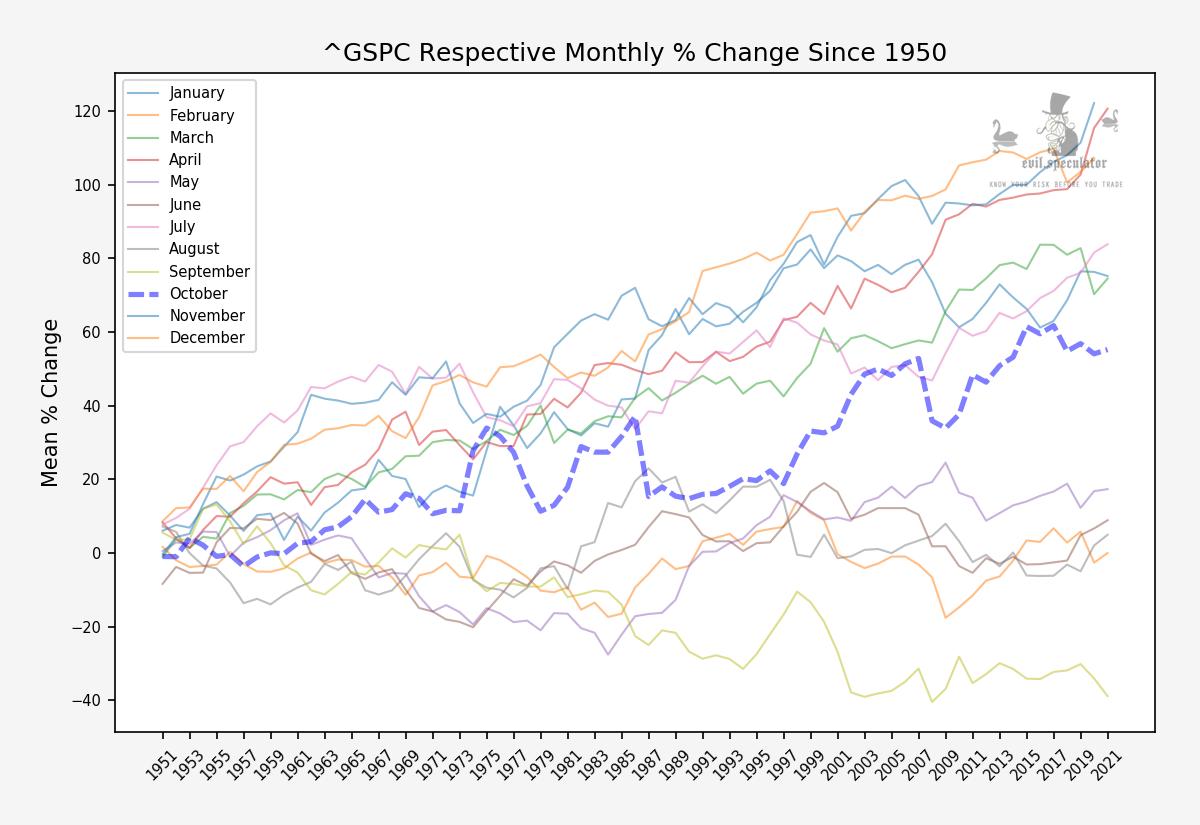
If you chain up all those October returns then what you get is shown above as a blue dotted line. Positive on average but not really a month you’d be riding in cruise control.
Now let’s take a look at week #40 – which seems to have a few surprises up its sleeve:
[MM_Member_Decision membershipId='(2|3)’]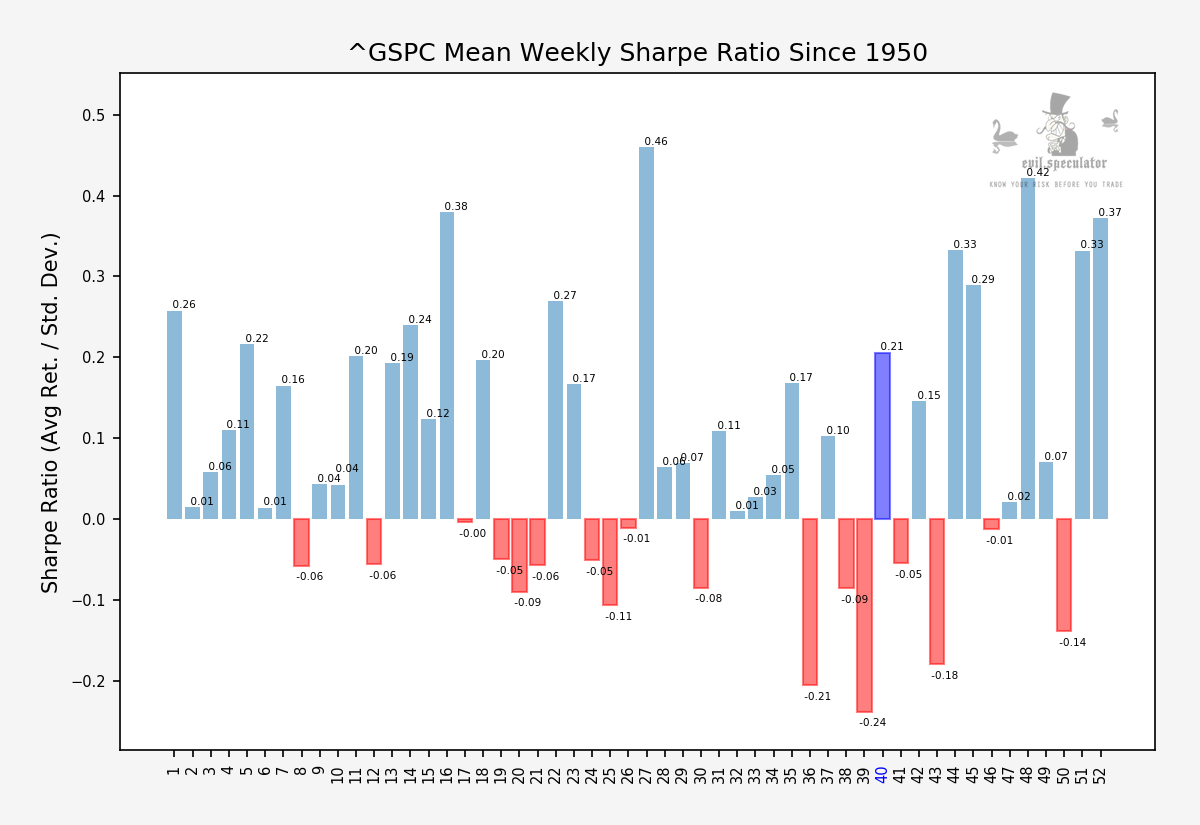
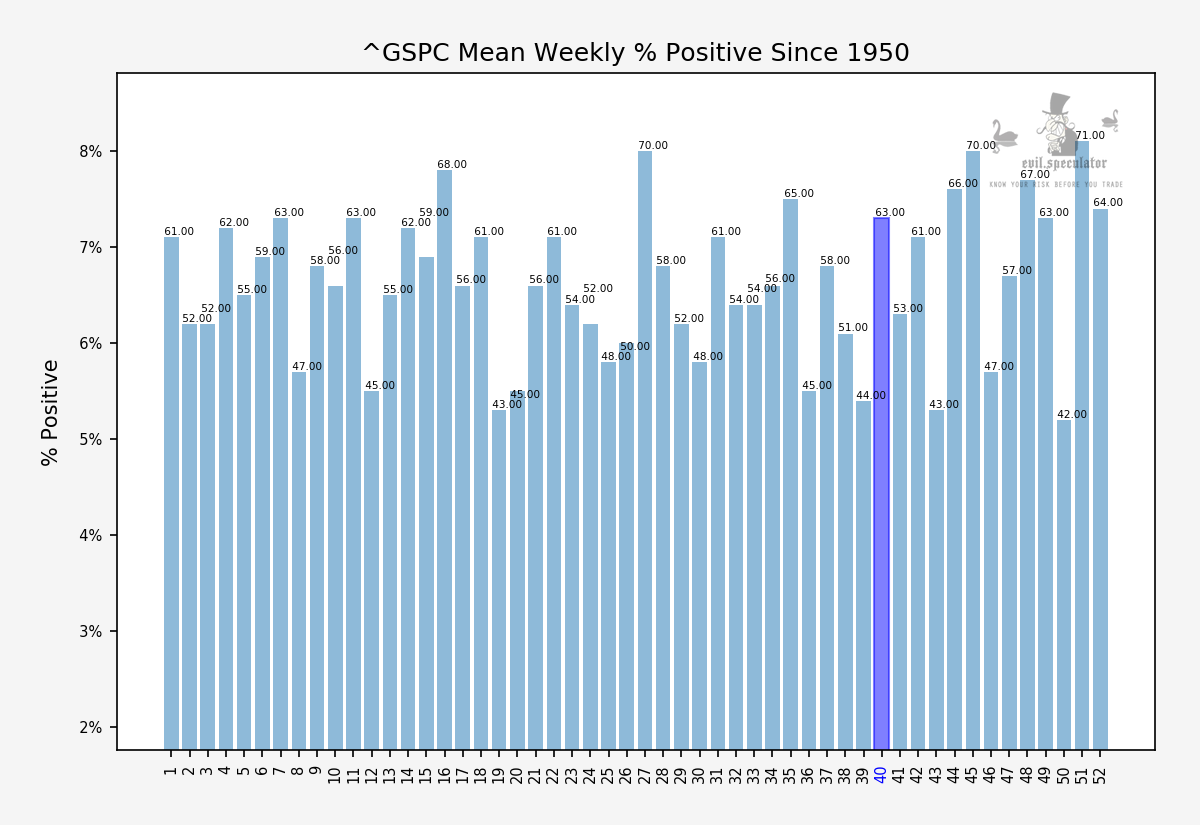
Given what I’ve shown you thus far the weekly Sharpe ratio for week #40 is a bit surprising. It’s not an awesome week but it’s somewhere around the median.
At a whopping 63% the odds for a positive close are solidly in the bull’s side of the court. I take that bet any day of the week as you probably can guess.
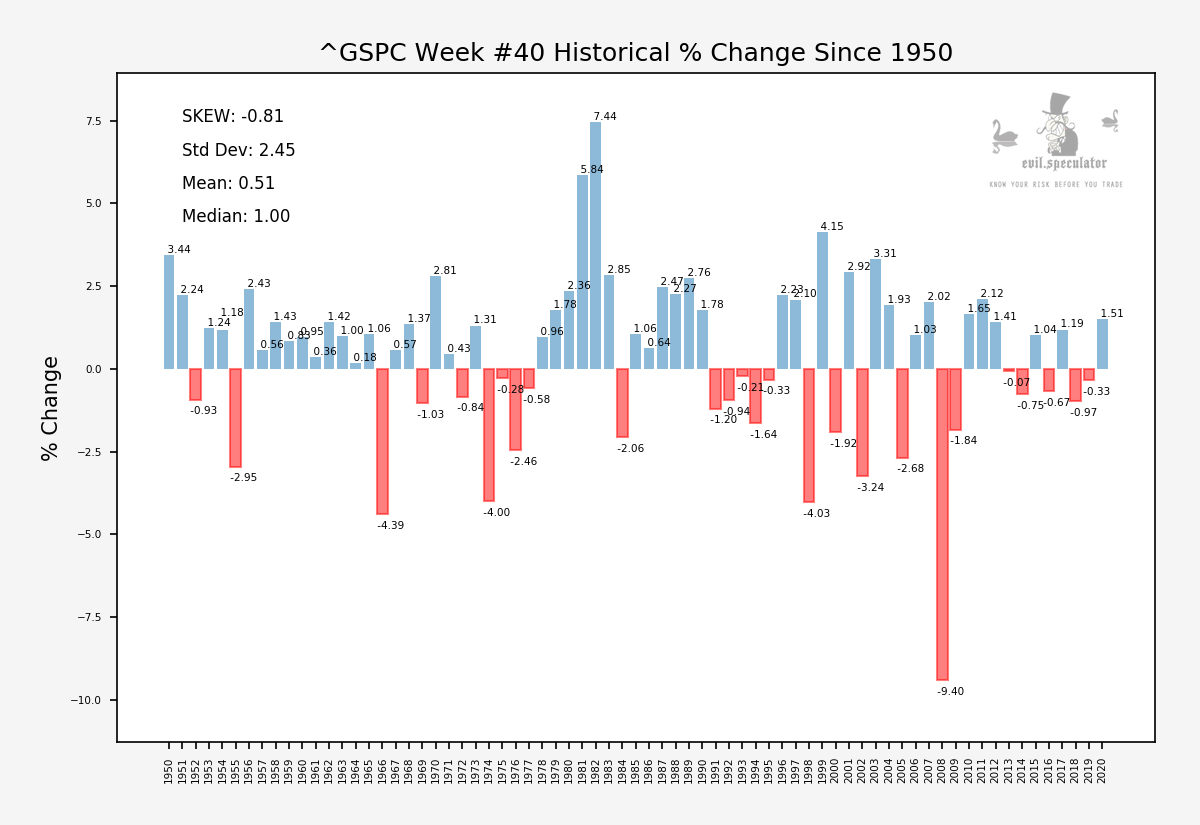
Once again here’s a graph with all the returns since 1950, but only for week #40 this time. It seems that big slide in 2008 actually occurred during the first week of October.
In fact the way week #1 goes seems to pave the way for the entire month. So let’s see what happens in the coming sessions. I’ll most likely bet to the upside unless given a pressing reason not to. If that is the case I’ll be sure to let you guys know.
Happy trading but keep it frosty.
[/MM_Member_Decision] [MM_Member_Decision membershipId=’!(2|3)’] Please log into your RPQ membership in order to view the rest of this post. Not a member yet? Click here to learn more about how Red Pill Quants can help you advance your trading to the next level.[/MM_Member_Decision] [MM_Member_Decision isMember=’false’] Please log into your RPQ membership in order to view the rest of this post. Not a member yet? Click here to learn more about how Red Pill Quants can help you advance your trading to the next level.
[/MM_Member_Decision]


