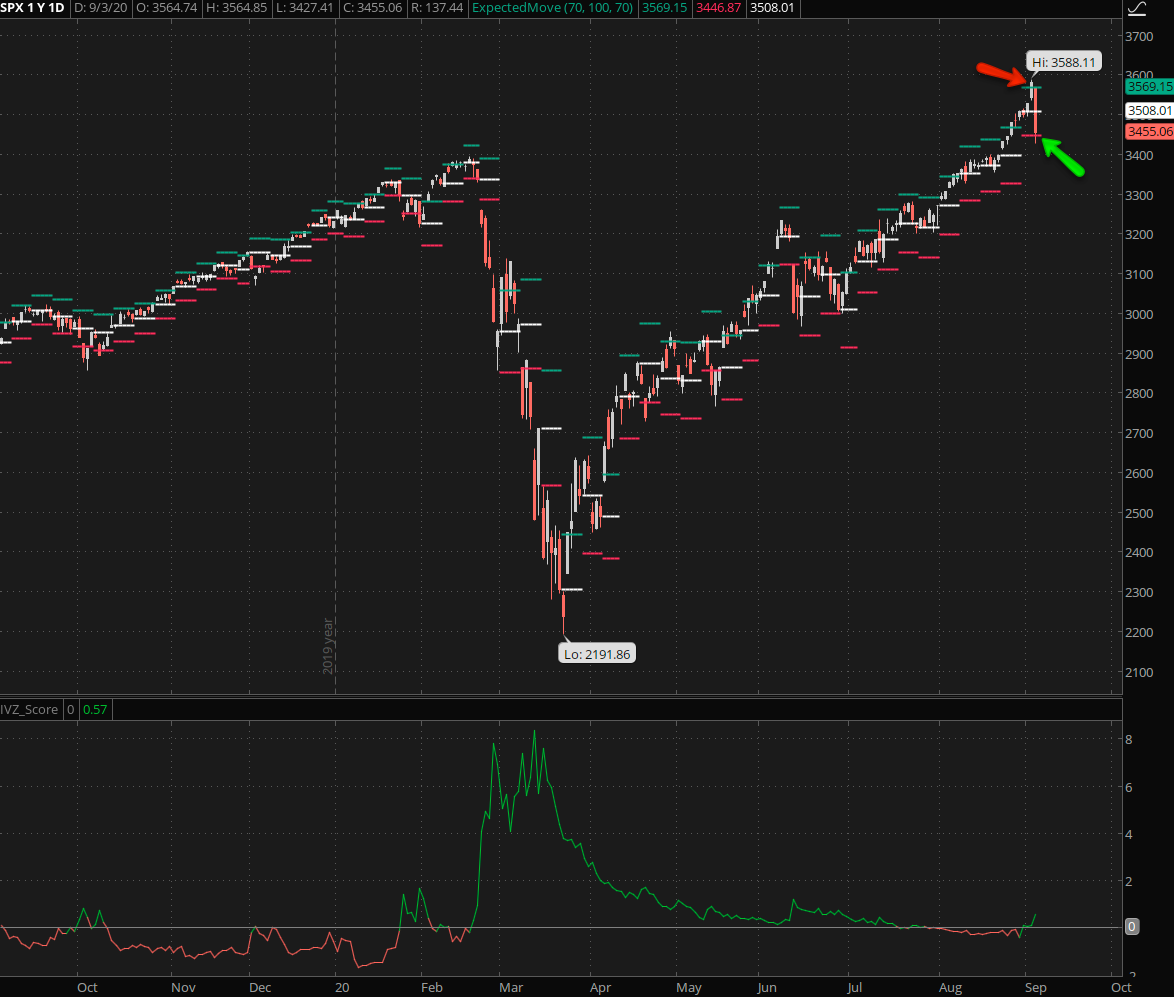
Well that didn’t take very long now, did it? Just two days ago I was bemused by a market seemingly running on cruise control and pushing up vertically during what is historically considered a bearish week. Of course the ensuing correction yesterday looks rather obvious in hindsight to the uninitiated, but let me assure you that I have seen raging rallies like these extend far beyond anyone’s imagination on numerous occasion in my time. In other words, if you somehow managed to pin the top then strike it up to good luck and keep your ego in check.
Interestingly the ATHs almost exactly reversed at the upper expected move (EM) threshold and, after having burned a boat load of stops, bounced back near the lower EM threshold. Coincidence? I think not.
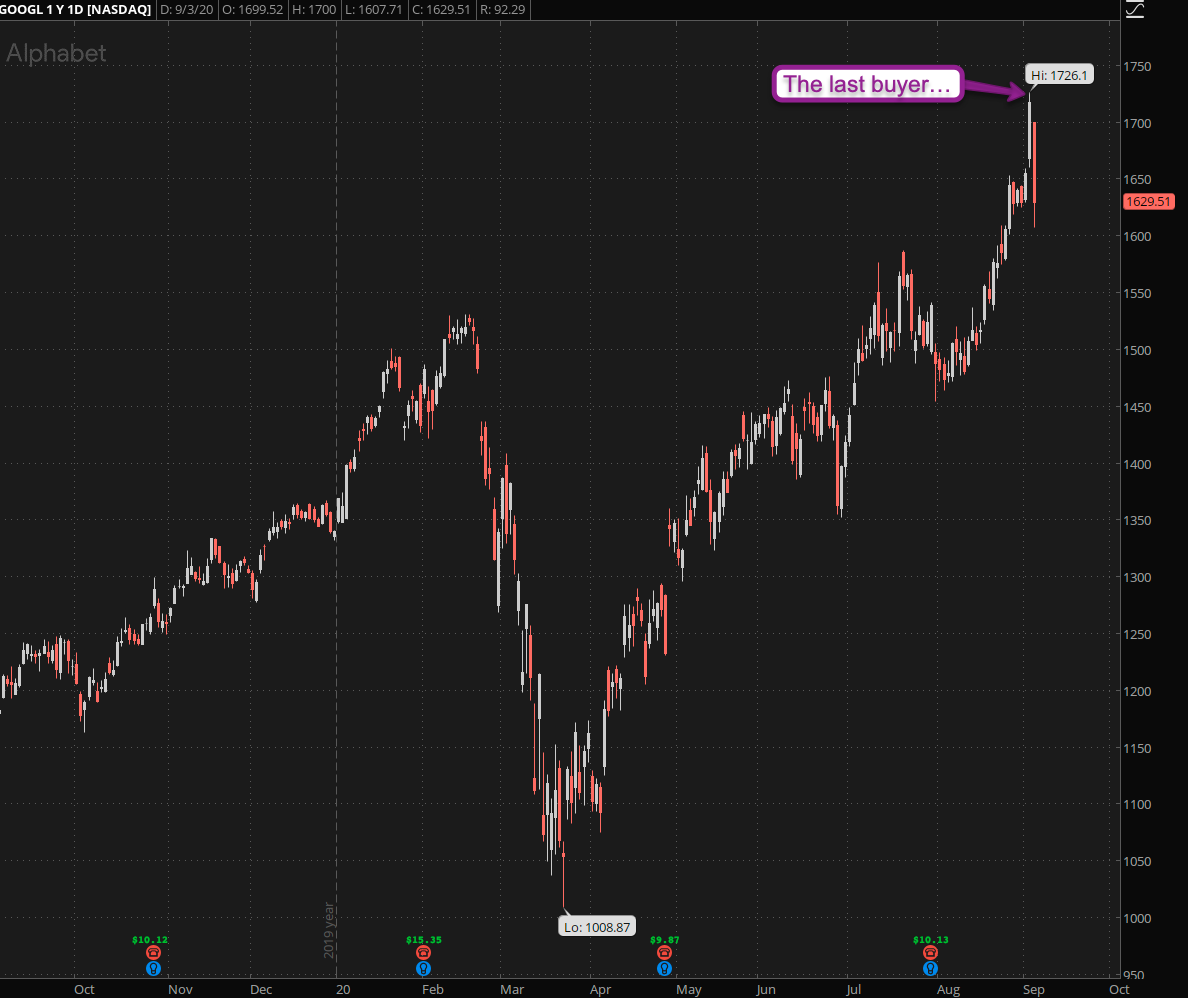
To nobody’s surprise previously high flying tech stocks got hit particularly hard. Not because they are ‘overvalued’ or deserve it – that’s a different story – but at some point you simply run out of buyers, especially heading into a long weekend and with participation running on fumes (see the Zero indicator over the past few sessions).
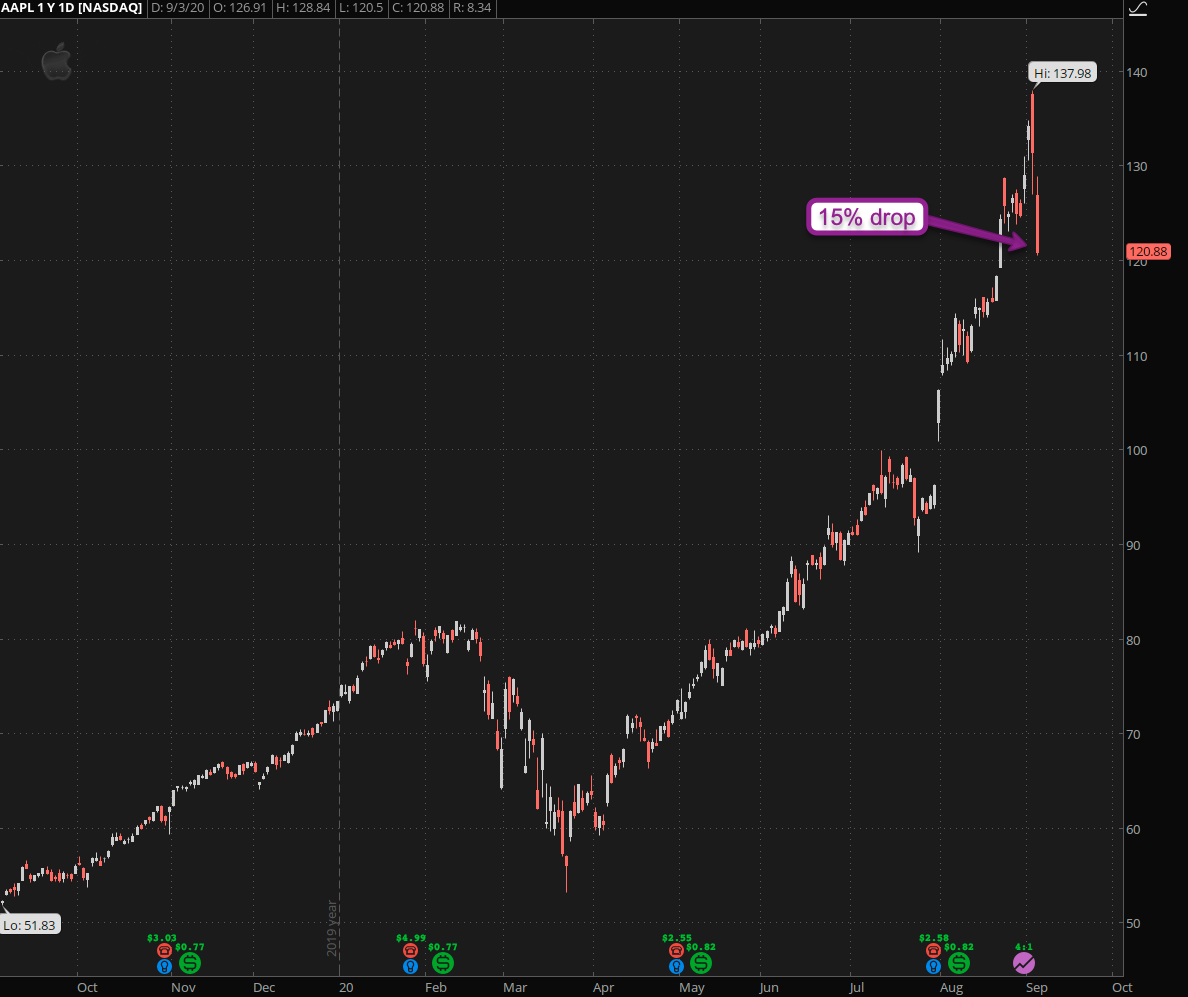
Sellers took a big bite out of AAPL which dropped 15% in two sessions. Will the carnage stop here? Tough to say but the disadvantage of a relentless rally like this is that it does not leave much in terms of technical support levels investors/traders can hang their hats on.
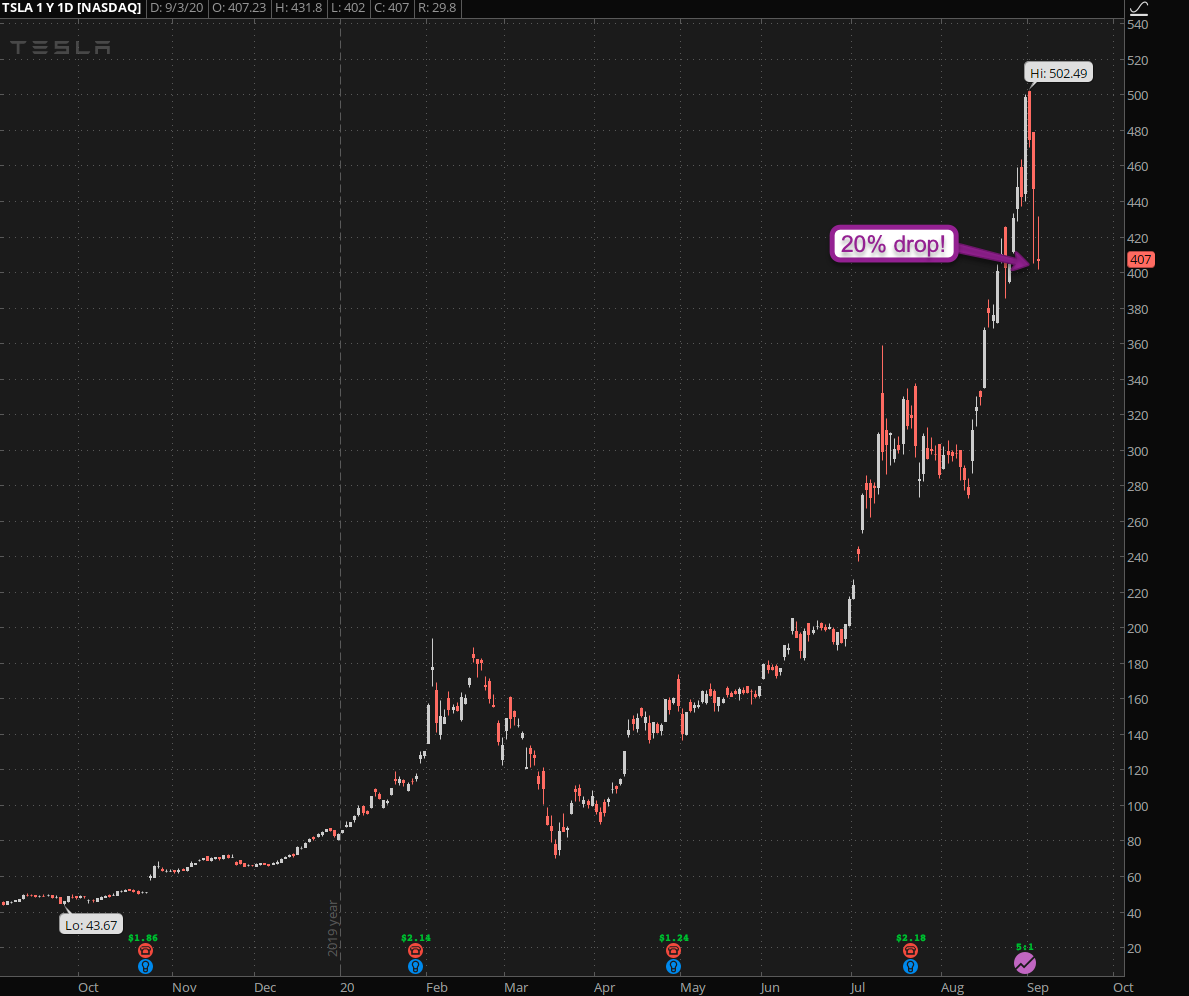
As usual TSLA is outdoing everyone else in the volatility department and went from 500 to 400 in 48 hours flat. The good news: it’s still trading near $400 but once again I don’t see much in terms of technical context here, so today’s session may get interesting.
There are two chart that really gripped my attention however as they may offer us an exciting opportunity next Tuesday:
[MM_Member_Decision membershipId='(2|3)’]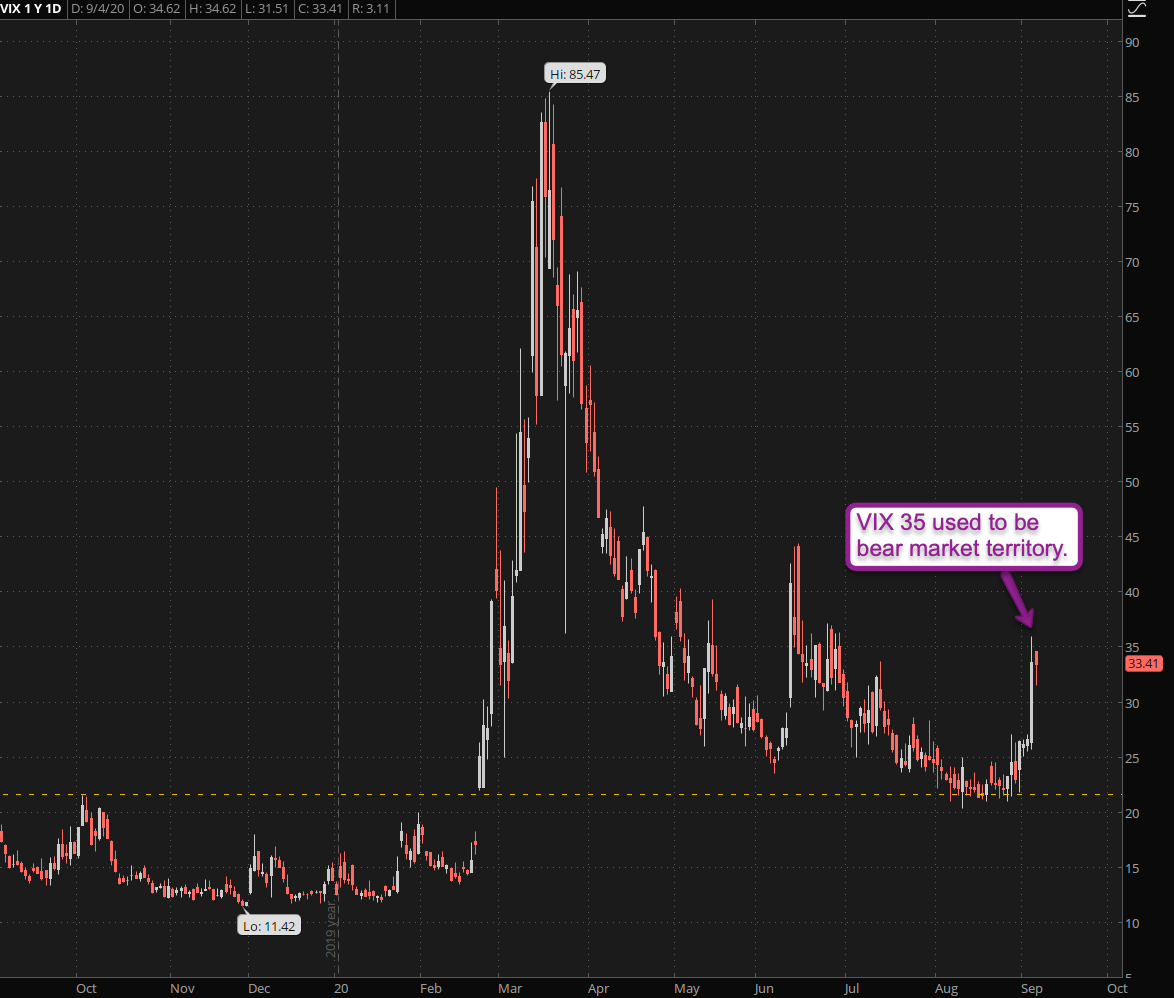
You probably guessed it – it’s the VIX. If you’ve only been trading for a year or two then this may not be apparent to you but traditionally a VIX at 35 was considered deep bear market territory with anything above increasingly degrading into panic mode.
All it takes in 2020 apparently, after a decade of almost non-stop QE, is a small short term correction to get everyone’s knickers into a twist. I assume you recall my VX product depth chart I posted on numerous occasions?
Perhaps now we know why the October VX contract (now our front month) has remained elevated for quite some time now. If you are an LT investor I hope you heeded that warning.
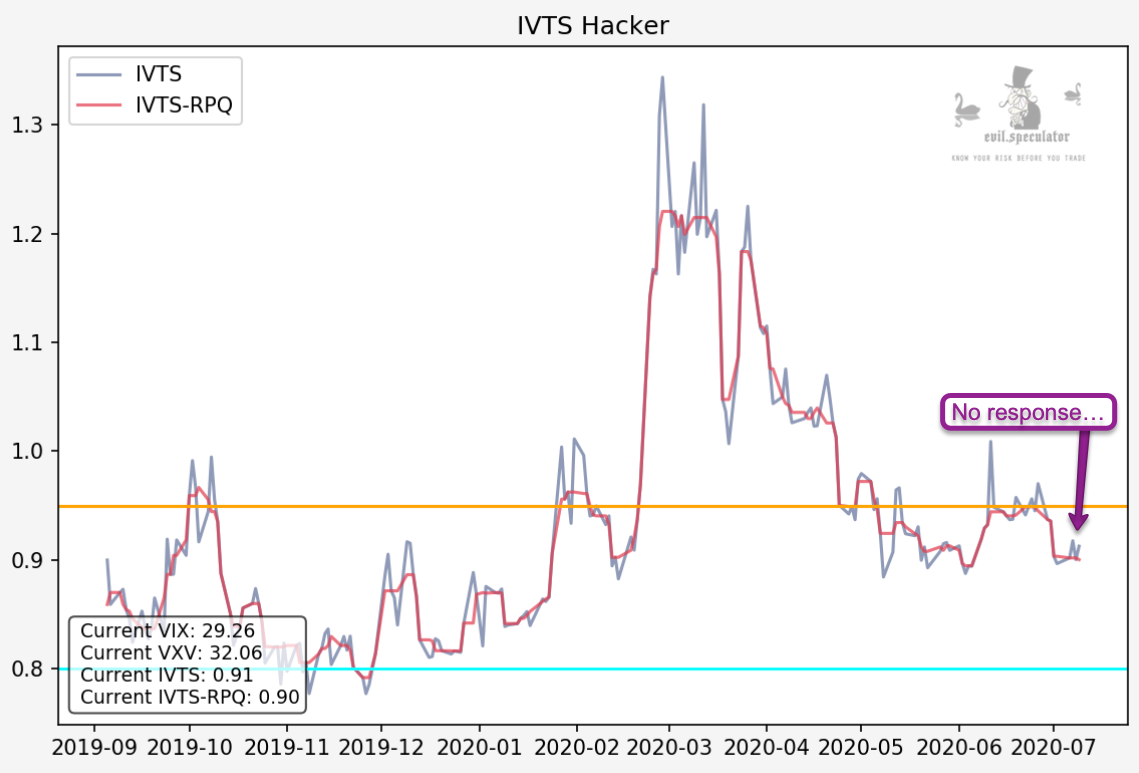
I was talking about possible opportunities after Labor Day next week and the reason for that is the current reading on the IVTS. Which has remained absolutely unimpressed about yesterday’s massive sell off.
I would of course never advocate loading up on puts today ahead of a long weekend but if this reading remains below its median and 0.92 in particular at the EOS today then we could be looking at an unfolding bear trap here. I personally won’t be taking any action today but will pay close attention next Tuesday.
[/MM_Member_Decision] [MM_Member_Decision membershipId=’!(2|3)’] Please log into your RPQ membership in order to view the rest of this post. Not a member yet? Click here to learn more about how Red Pill Quants can help you advance your trading to the next level.[/MM_Member_Decision] [MM_Member_Decision isMember=’false’] Please log into your RPQ membership in order to view the rest of this post. Not a member yet? Click here to learn more about how Red Pill Quants can help you advance your trading to the next level.
[/MM_Member_Decision]


