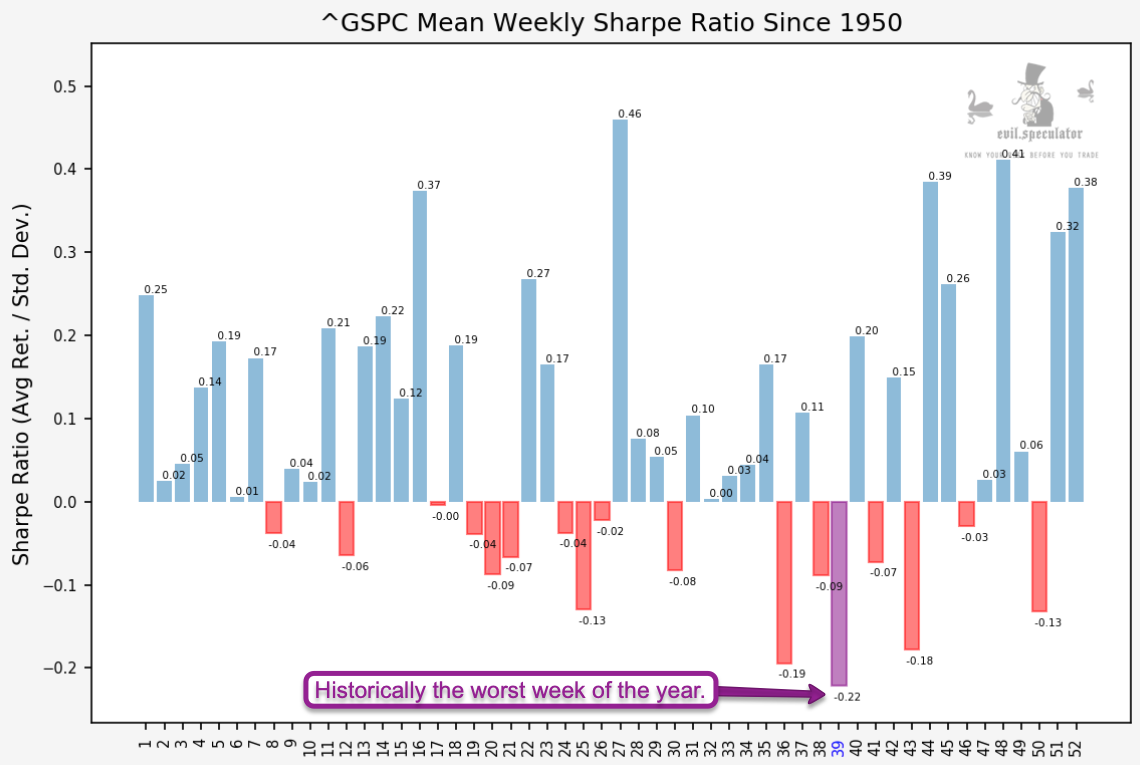
Welcome to the worst trading week of the year, at least historically speaking. I looked very hard but there really isn’t much good to say about week #39, which incidentally also marks the beginning of the fall season (starting tomorrow). At the same time however volatility (of the realized kind) is much subdued this week – in fact it’s the least volatile in all of September.
This may strike you as a bit odd but investor sentiment is usually delayed in that people in general have a disposition toward expecting more of what they just experienced. After all, you don’t see the mainstream media posting clickbait about earthquakes just out of the blue.
But they can’t stop talking about it after a big one just hit, despite the fact that the odds of another of the same magnitude happening anytime soon is usually very small. Admittedly I’m no expert on tectonic plate movements but after 20 years in the trading racket I do believe that I understand human nature fairly well.
That in combination of tangible statistics and seasonal trends has done wonders when it came to keeping me out of harm’s way. Of course it’s not the holy grail but in combination with the ongoing trend I consider it a valuable tool in my trading arsenal.
What we’re looking at for week #39 is a negative Sharpe ratio of negative 0.22. Doesn’t sound like much but remember that this is averaged out over the course of 70 years.
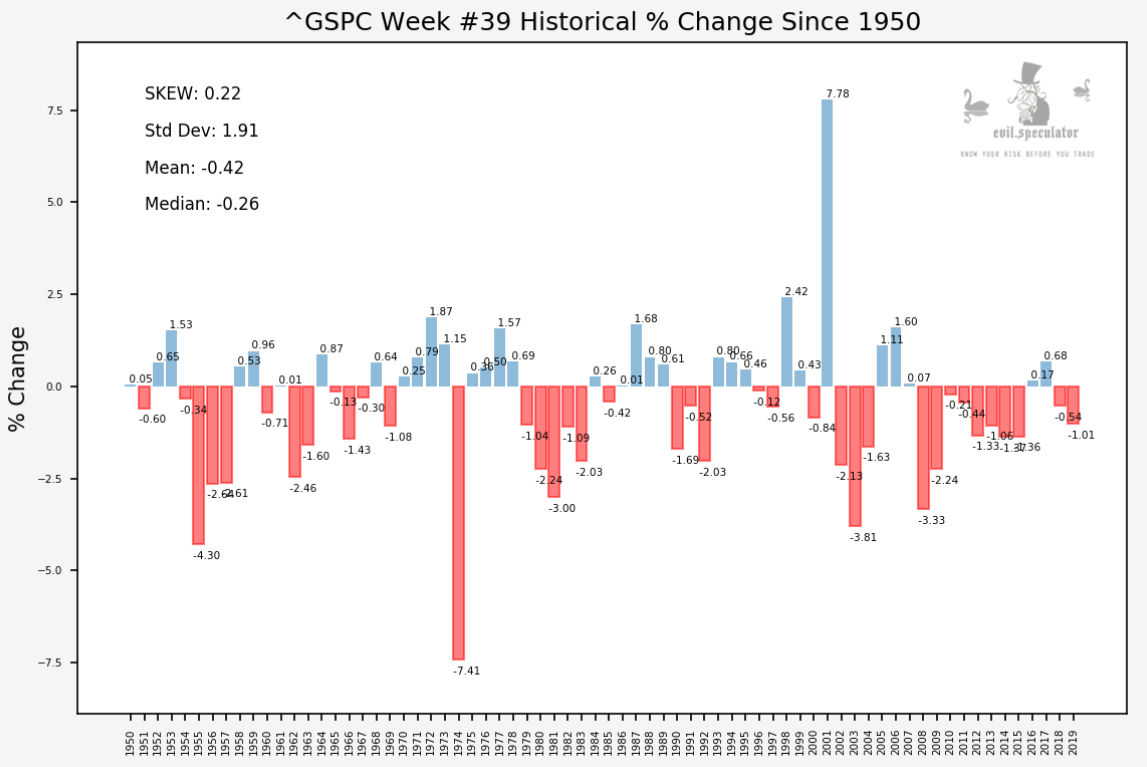
This how things look like if you actually plot all the entire dataset as percent change graph. I see one really awesome week (2001), a bunch of ‘meh’ weeks, and a lot of pretty bad weeks.
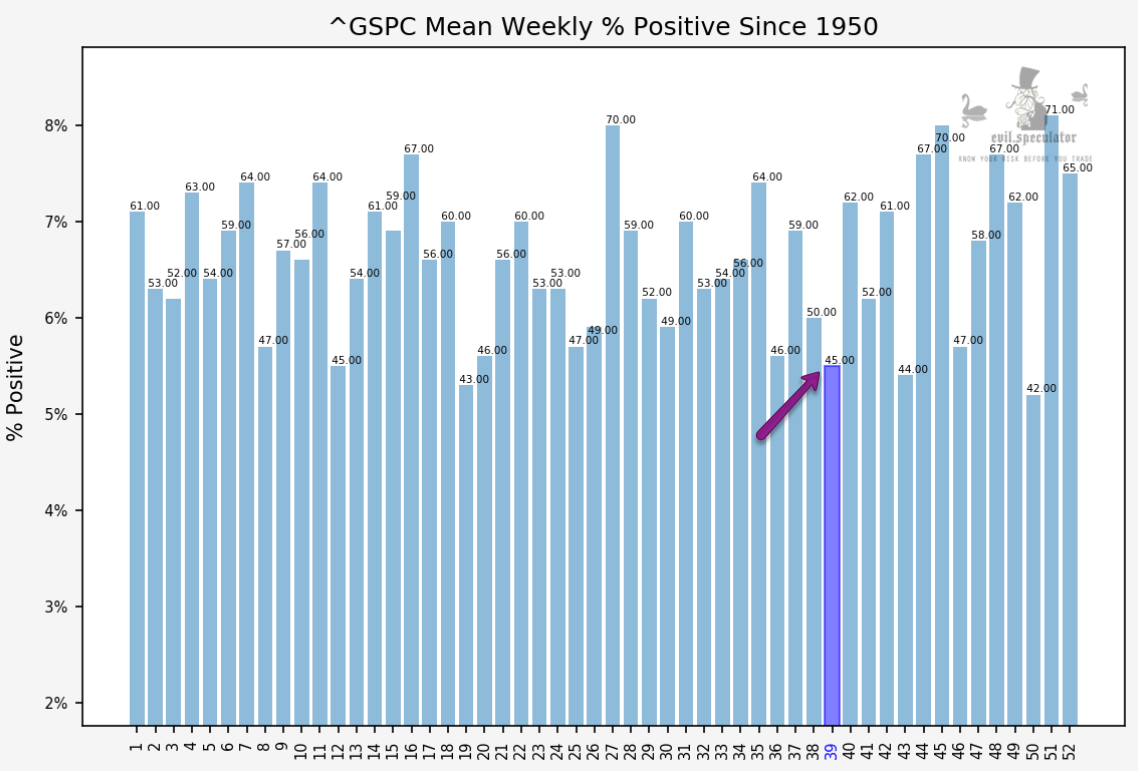
In fact on average week #39 only managed to eke out a positive close in 45% of all cases. In that regard it’s the 4th worst week of the year along with week #12.
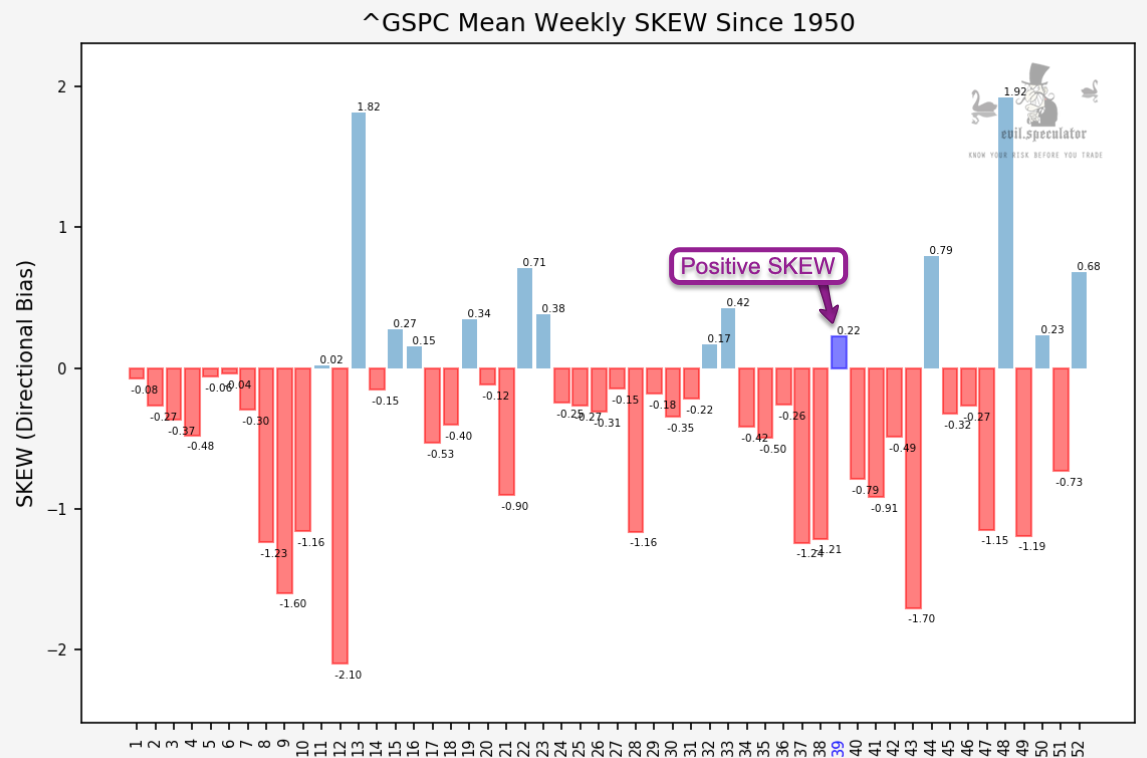
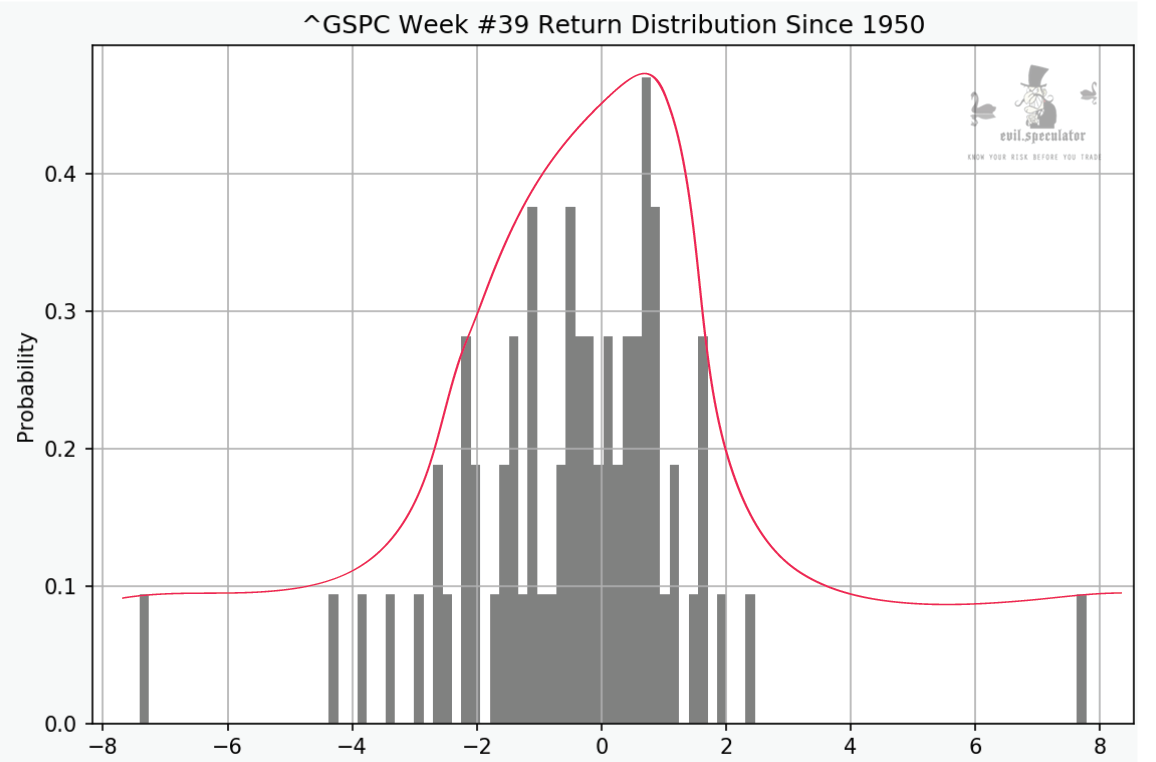
SKEW for this week is positive in that the negatives heavily dominate the dataset.
The return distribution makes this a bit more clear and I’ve also drawn a line to drive home that point.
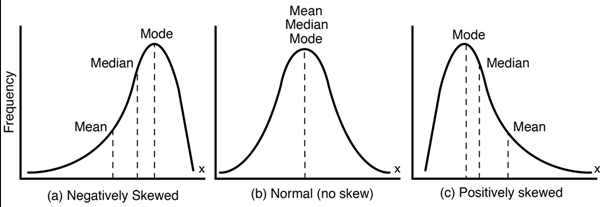
Clearly the median is to the left of the mean – worse yet it’s dominated by negative closes.
Now in my intro I was talking about entering the ‘eye of the storm’ and that’s the only piece of good news I am able to report:
[MM_Member_Decision membershipId='(2|3)’]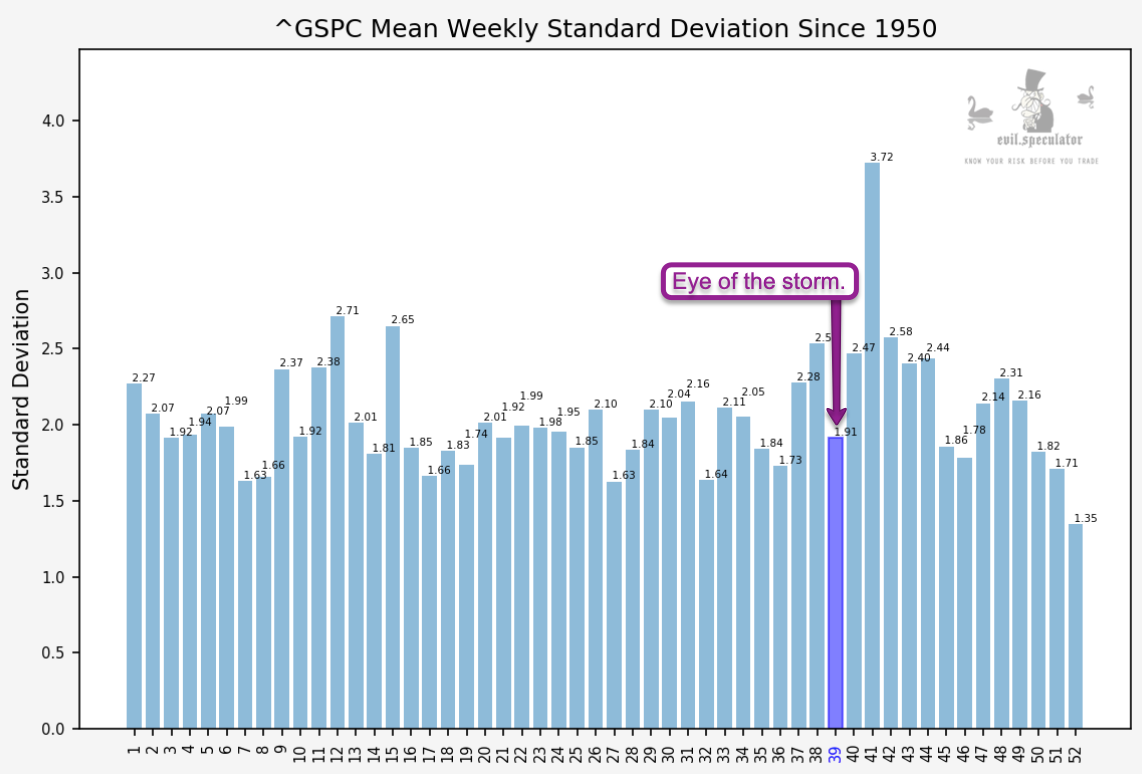
Weekly standard deviation has us at 1.91, which is outright quiet – given what lays ahead. So it’s possible that way me see a slow slide lower followed by a major bounce next week (pushing realized volatility higher).
If you’re a savvy swing trader this can be fun but be cautious with your naked puts next week as you may get reamed.
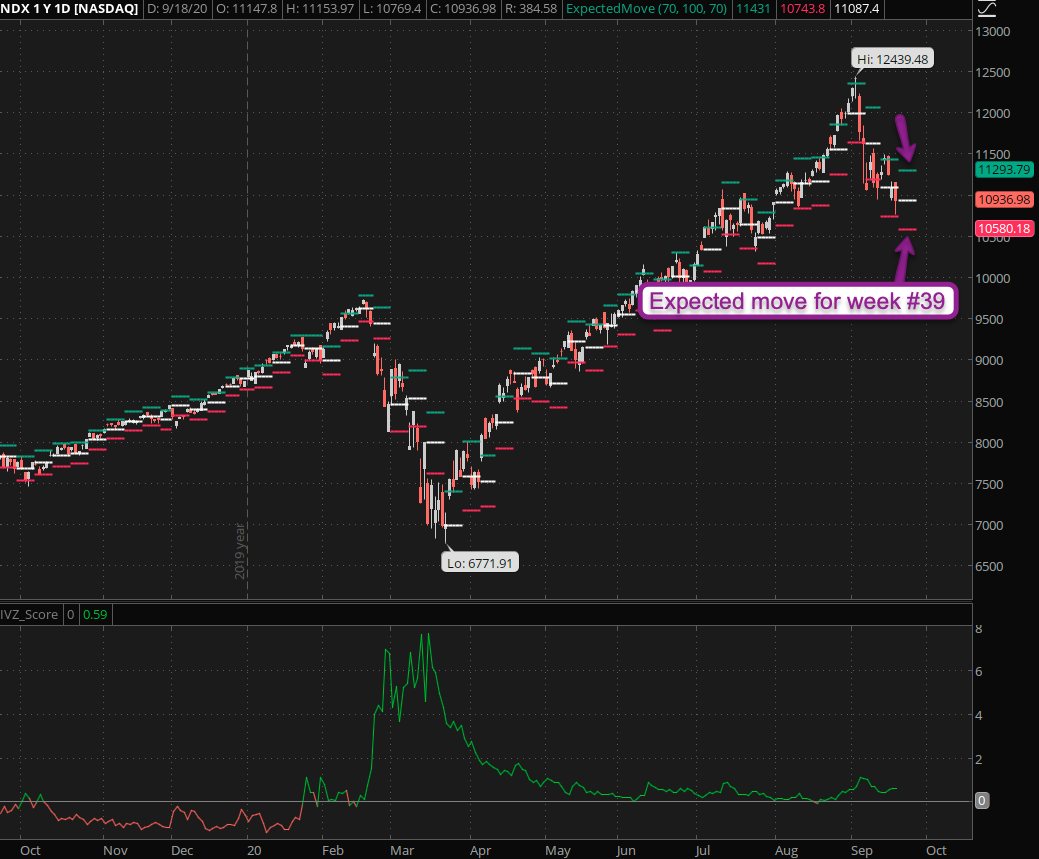
If you’re looking for early signs of a bounce keep an eye on the NDX and big tech in particular. Right now it’s not finding much of a bid and until that changes it’ll keep dragging the rest of the market lower.
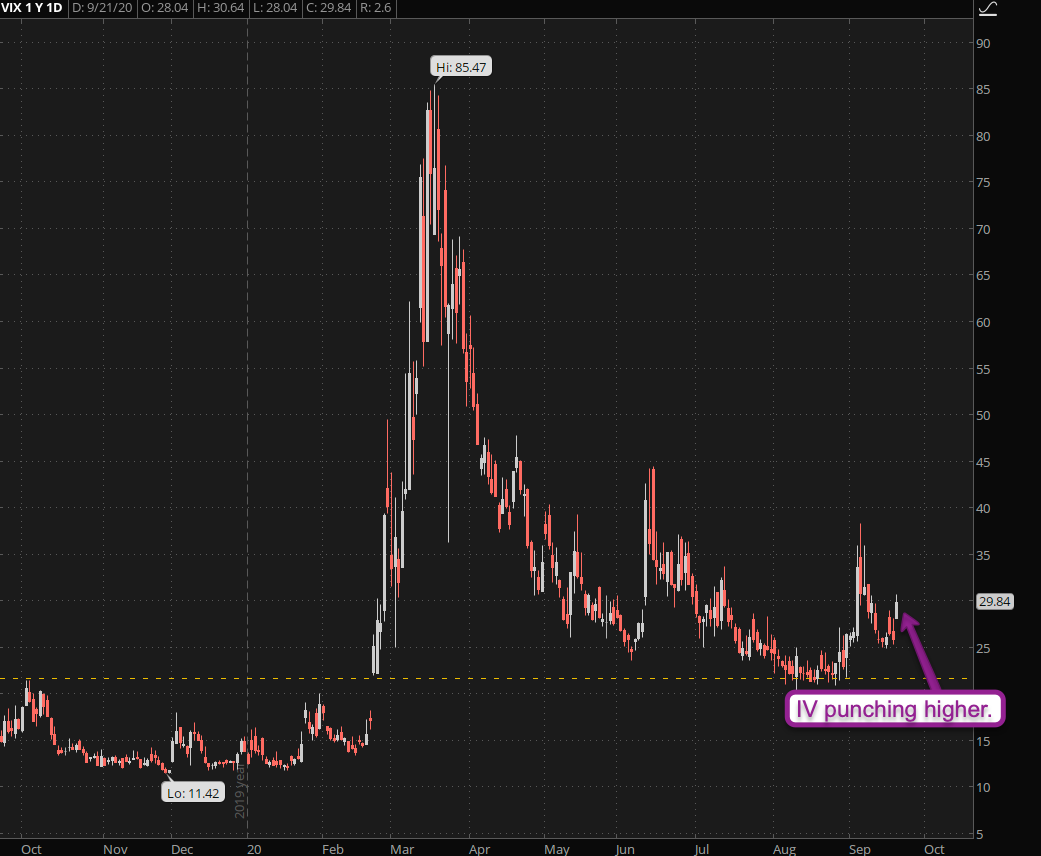
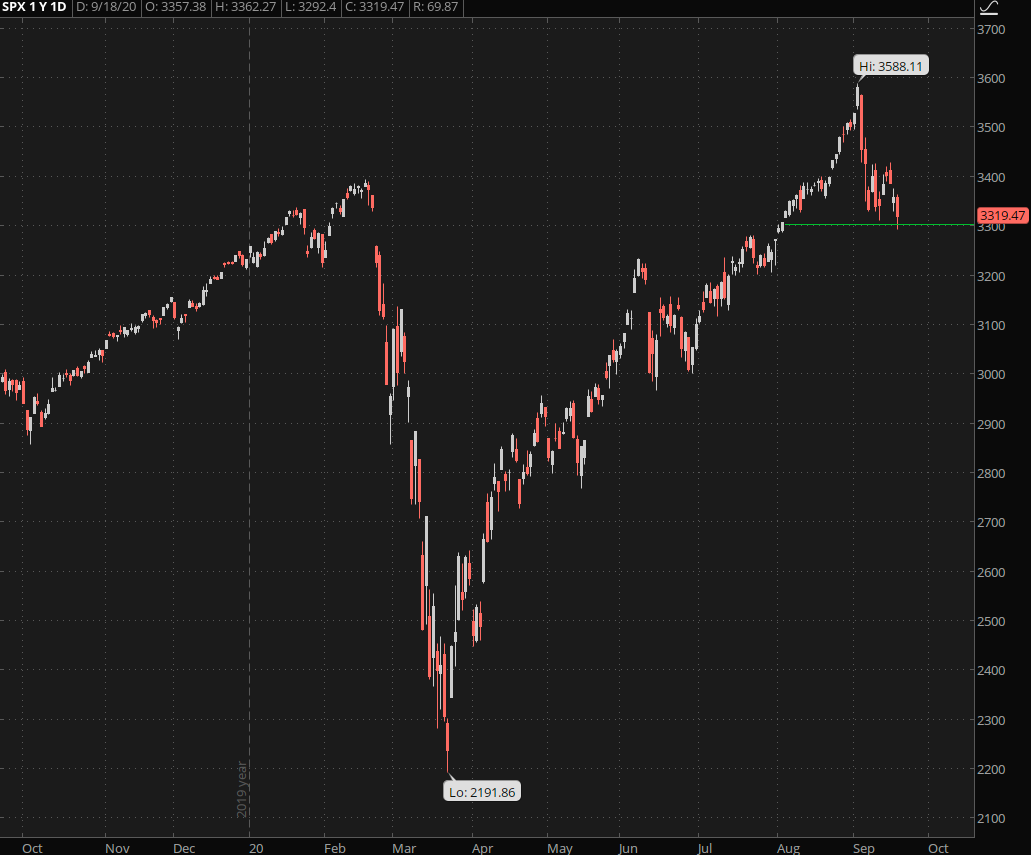
The VIX has been punching higher on Friday after the SPX 3300 mark was briefly breached.
Clearly we’re looking at a boat load of hedging activity on the other side of that so watch what happens here over the next two sessions. Another stab lower – after the first exploratory one last Friday – is almost guaranteed to rock some boats and draw prices lower toward SPX 3200 and perhaps even lower.
Bottom Line:
Historically realized vol (RV) is low this week but implied vol (IV) is on the rise again. The bulls have a chance to defend the ongoing trend before things go out of hand. Right now the current formation can still be written off as a simple ‘overdue correction’. But if SPX 3200 or – heaven forbid – SPX 3000 falls then all hell may break loose.
It’s bear season – trade accordingly.
[/MM_Member_Decision] [MM_Member_Decision membershipId=’!(2|3)’] Please log into your RPQ membership in order to view the rest of this post. Not a member yet? Click here to learn more about how Red Pill Quants can help you advance your trading to the next level.[/MM_Member_Decision] [MM_Member_Decision isMember=’false’] Please log into your RPQ membership in order to view the rest of this post. Not a member yet? Click here to learn more about how Red Pill Quants can help you advance your trading to the next level.
[/MM_Member_Decision]


