Financials kicked off the final earnings season of 2020 and as a card carrying manic market megalomaniac it is incumbent on me to start parsing for potential IV squeeze victims. Much to the chagrin of some of you directional cowboys that is my favorite play but I would be remiss to not point out that implied volatility is not the only way to play earnings. But let’s take things from the top by looking at the overall market:
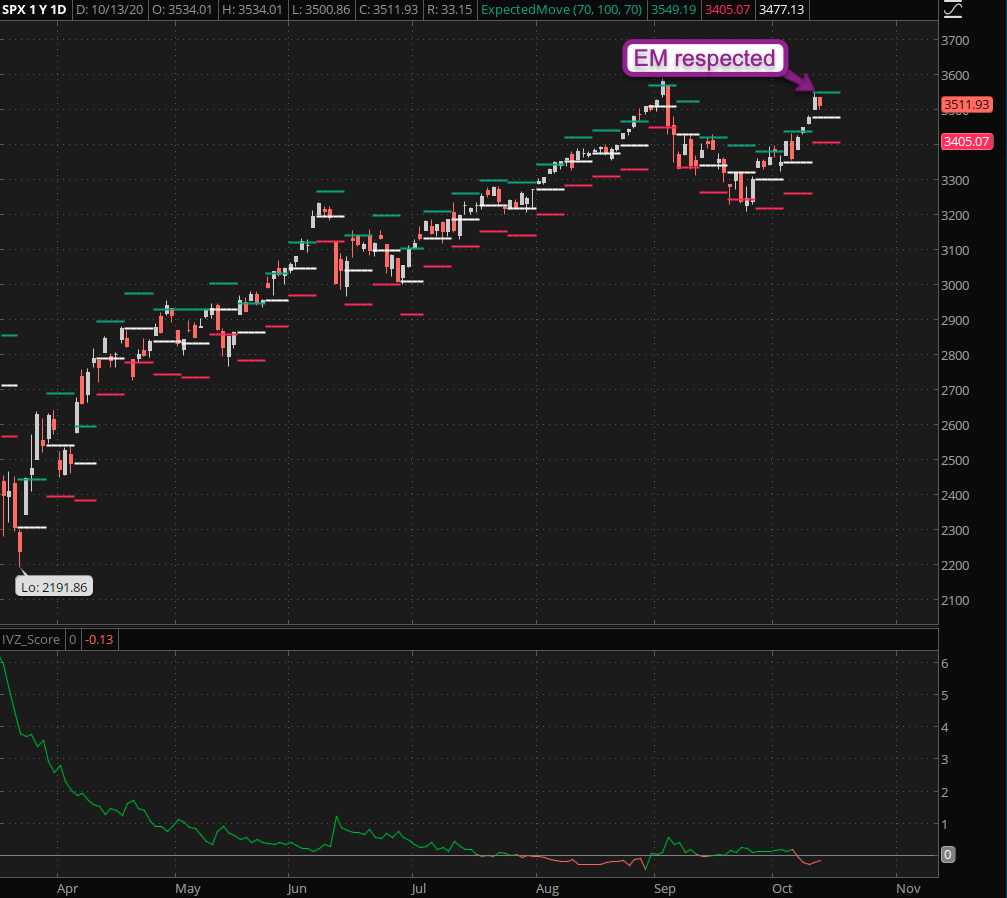
Once again the upper expected price threshold near SPX 3549 as the strain proved too much for it to bear. That said, we saw a similar response last week but it was followed by a 2 sigma move to the upside. With three more sessions to go in a volatile pre-election earnings season pretty much anything can happen and it probably will.
I mentioned financials in my intro as represents a good segue to the symbols we’ll talk about below. Namely that several contenders posted positive earnings results (e.g. JPM and GS) but encountered the proverbial buy the rumor sell the news phenomenon.
Which brings me to the list of earnings victims I promised. All of these were extracted via a python script that pulls them out of finviz. Among the main criteria:
- Earnings within the next 10 days.
- Volume > 20,000
- Price > $20
From there I dismiss anything that announces earnings today or tomorrow as we need a few days in between so we can benefit from inflated front week IV. Although the trades are directional they also benefit from post earnings drop in vega in the front month contract.
Now let me show you how these can be traded:
[MM_Member_Decision membershipId='(2|3)’] All the symbols posted are candidates for one of the following option strategies:- Short Calendar spread (far OTM beyond one of the expected price thresholds).
- Short Diagonal spread (far OTM beyond one of the EPTs – with front month long strike a bit further toward the money to reduce blow out risk).
- Butterfly (body placed near one of the two EPTs).
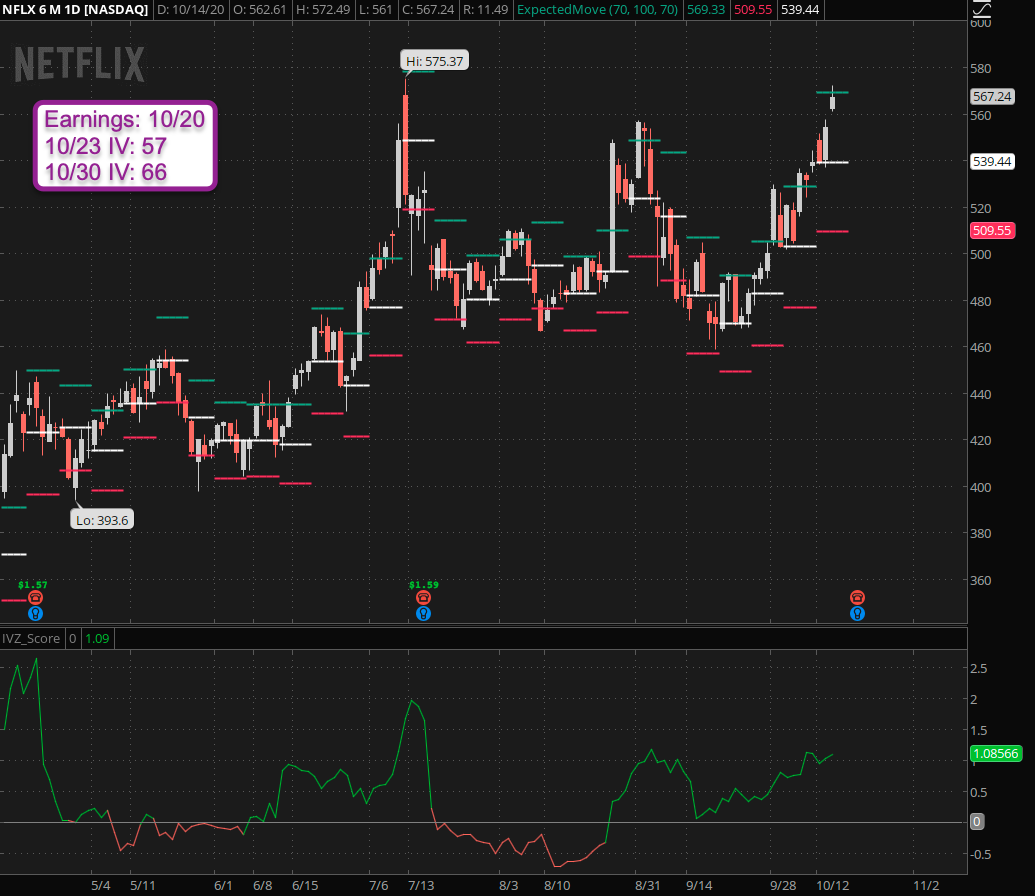
Let’s take Netflix for example which has earnings on 10/20 – next Tuesday after the market closes. It’s been running up higher and it’s quite possible that we are also dealing with a buy the rumor sell the news type of scenario.
Expected move is important here and the EM for the 10/23 is 57 and it’s the one we are primarily interested in. So if you do the math: We are currently trading at around 563 – add 57 and you get to 620. That is our upper expected price threshold (EPT).
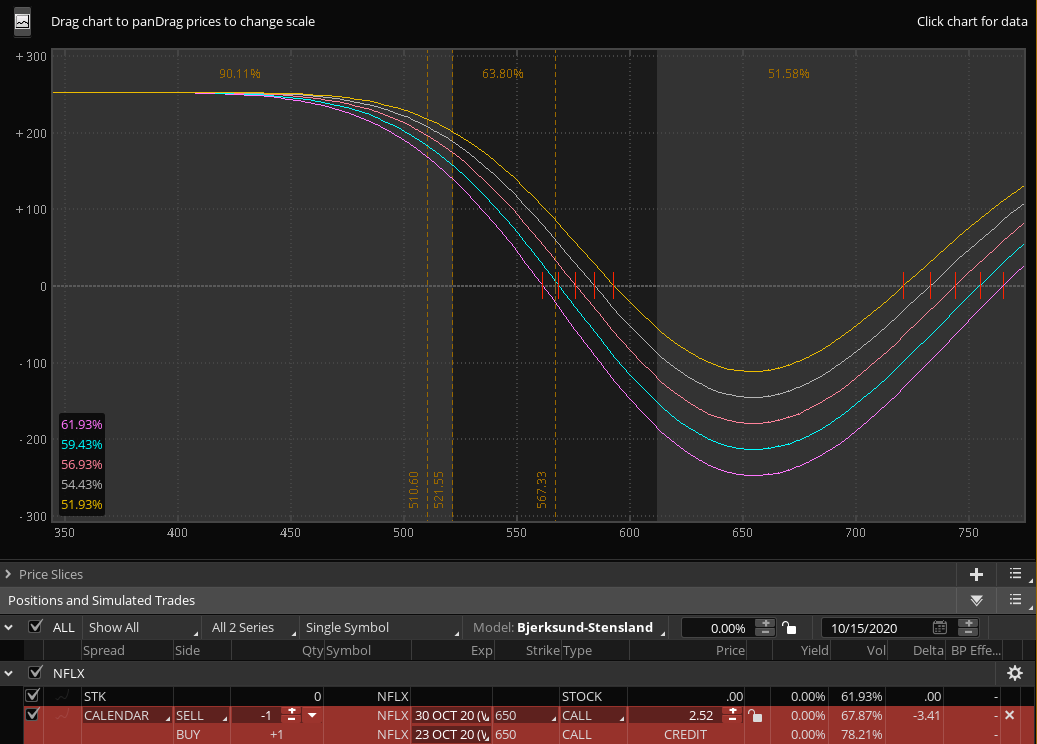
NOW, let’s place some trades, starting with the short calendar spread. We will place our calendar far OTM above our upper EPT at 620:
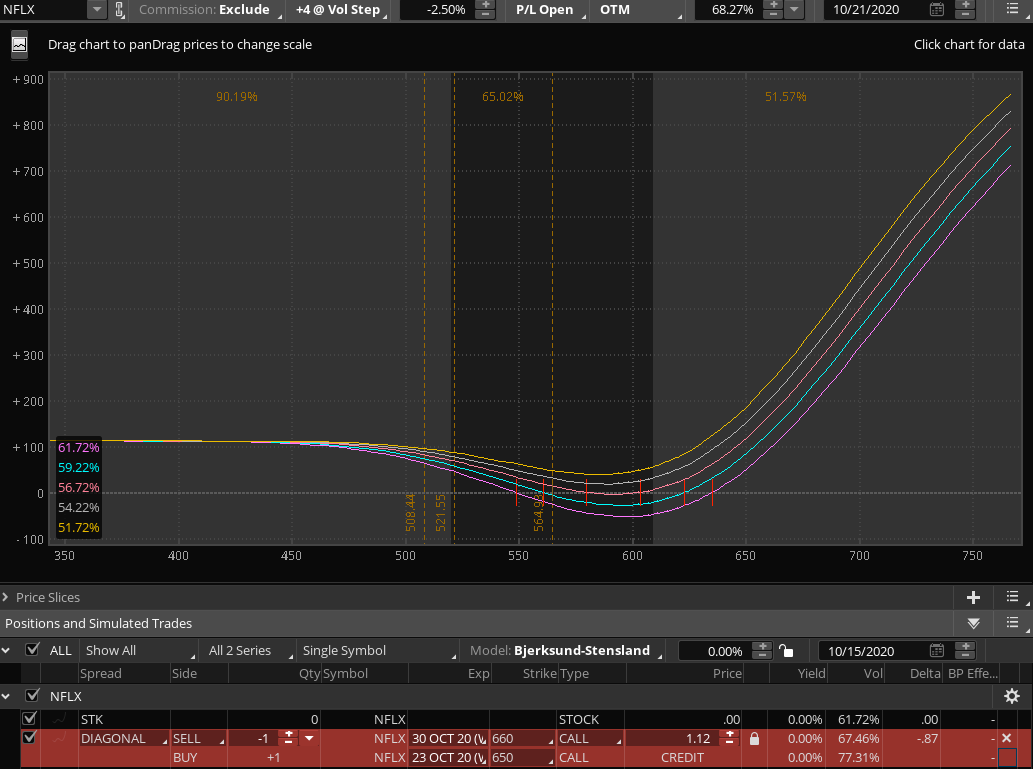
As you can see I chose to sell a 650 calendar which is 30 handles higher than the EM. That does not completely put us out of danger however but I like the risk to profit ratio.
The way I’ve set up the TOS simulator is to show me drops in implied volatility in -2.5% intervals. It’s difficult to imagine that we won’t see at least a 5% drop post earnings and that should get me to break even until about NFLX 563 – which is where we are currently trading.
This trade would be closed post earnings announcement, meaning on the morning of October 21st.
Here is an equivalent diagonal. I have pushed the long call a bit closer toward the money to reduce blow out risk. Now don’t let this profit curve fool you – diagonals can lose money but I have done pretty well with them during earnings, especially on symbols with inflated IV.
Otherwise it’s the same idea, as we believe NFLX is going to be sold off post earnings which is why we placing these trades on the other side of the upper expected price treshold, hoping the strikes will expire worthless.
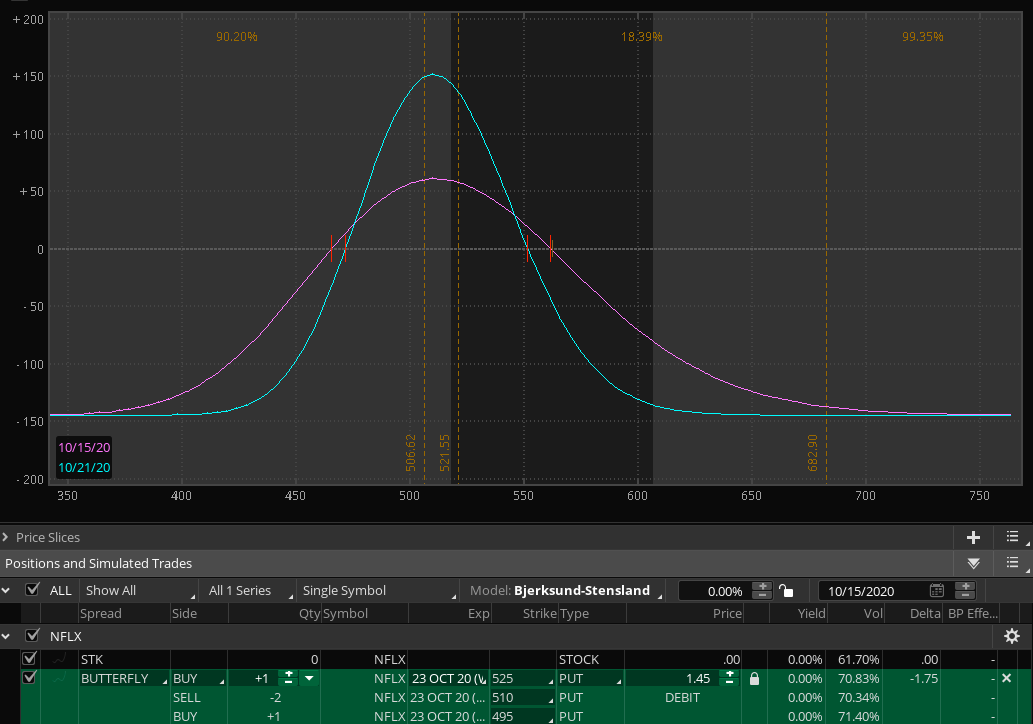
Now this looks pretty measly – I must admit. And it should as the odds for this trade to succeed officially are only 9.7%. I cover how to calculate probability for any spread in my Options 201 series and it is also discussed in my upcoming weekly butterfly series.
Yes, the odds for this one are low but IF Netflix falls post earnings then – despite what the official odds are telling us – are quite high that it’ll settle somewhere in this range between 450 and 550 – hopefully somewhere near 510. Also remember that we won’t be holding this trade all the way into expiration so both profits as well as losses should be much lower. It’s a much gentler trade than it may look on paper.
Again, we will discuss weekly butterflies – inside and outside of earnings season, in much detail in my upcoming video series. I’ve spent literally months working on this one and I am confident that it’ll put your option trading on a whole new level.
[/MM_Member_Decision] [MM_Member_Decision membershipId=’!(2|3)’] Please log into your RPQ membership in order to view the rest of this post. Not a member yet? Click here to learn more about how Red Pill Quants can help you advance your trading to the next level.[/MM_Member_Decision] [MM_Member_Decision isMember=’false’] Please log into your RPQ membership in order to view the rest of this post. Not a member yet? Click here to learn more about how Red Pill Quants can help you advance your trading to the next level.
[/MM_Member_Decision]

