
A dam breach is considered a catastrophic event and when one occurs in this day and age you rarely ever hear the end of it. Everyone’s focus is suddenly on the underlying reason for the dam’s failure and of course who or what is responsible.
There is an analogy in the financial markets that we all have observed but that usually receives a lot less attention: sideways ranges which are eventually breached after weeks of churn and then suddenly lead to either a shortsqueeze higher or a deep correction to the downside.
This may sound like a trite attempt to sensationalize what most would consider regular price action but if I am hyperbolic then it’s only to a small degree.
Reason being that not all sideways ranges are cut from the same tree and as usual context is everything.
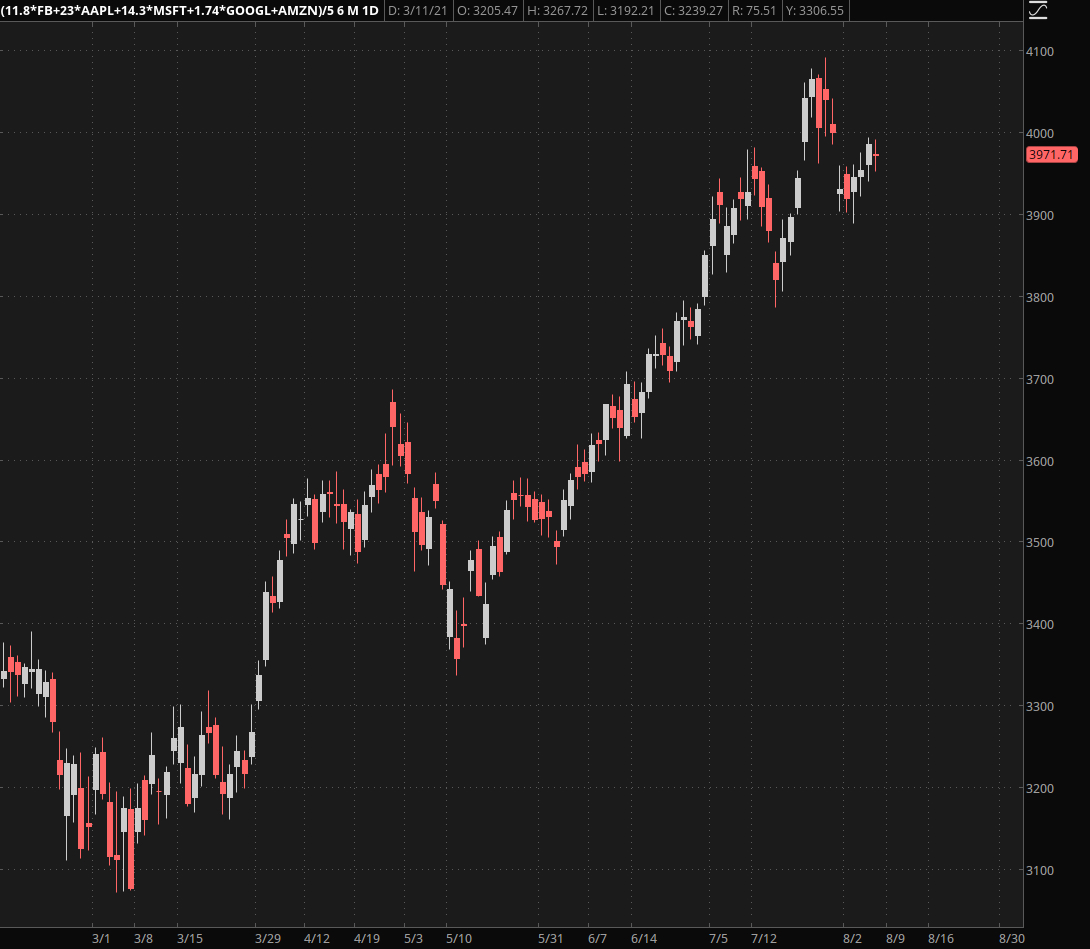
Over the past few weeks we’ve seen finance and technology – the two leading market sectors over the course of the past year – do absolutely nothing. The chart above shows my composite symbol comprised of various tech giants, i.e. FB, AAPL, MSFT, GOOGL, AMZN, and most recently TSLA.
What’s immediately apparent is that the sector is in an uptrend but it’s not doing anything right now. So what’s driving this advance?
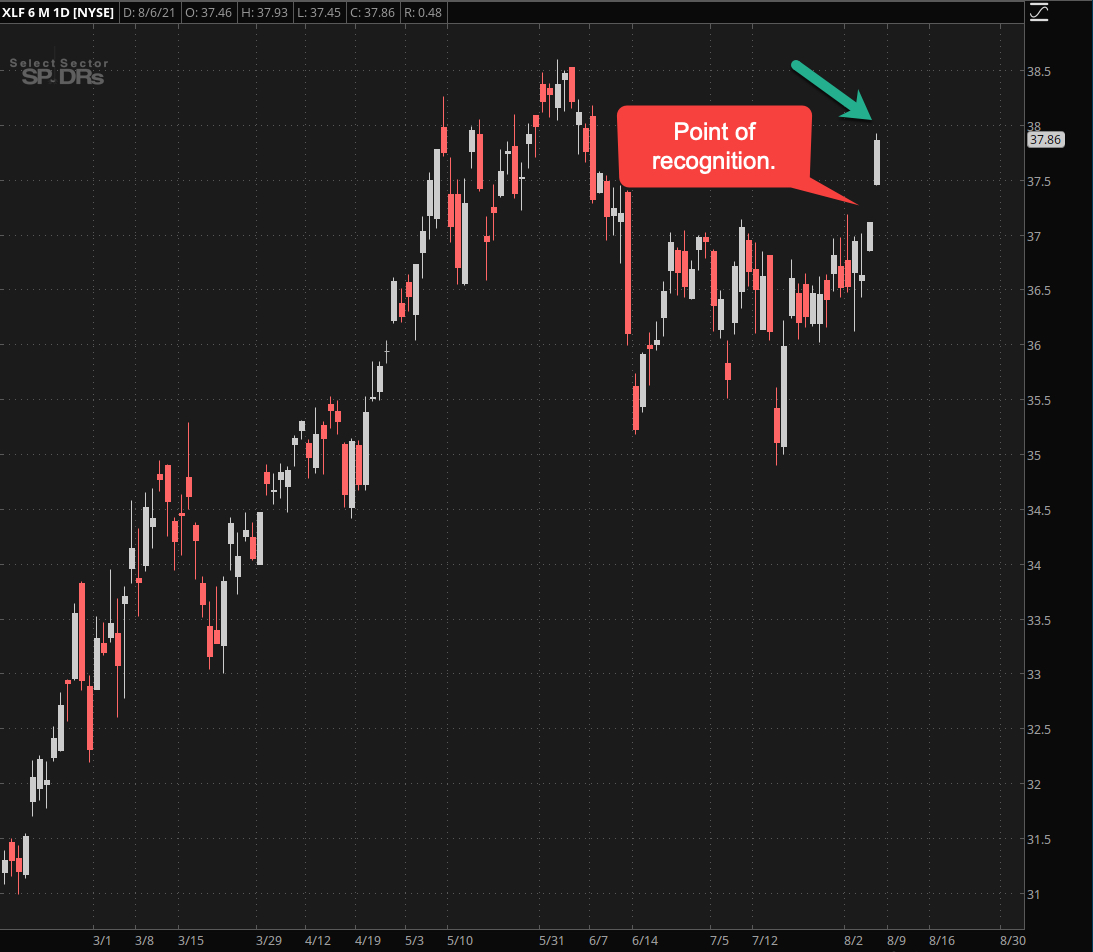
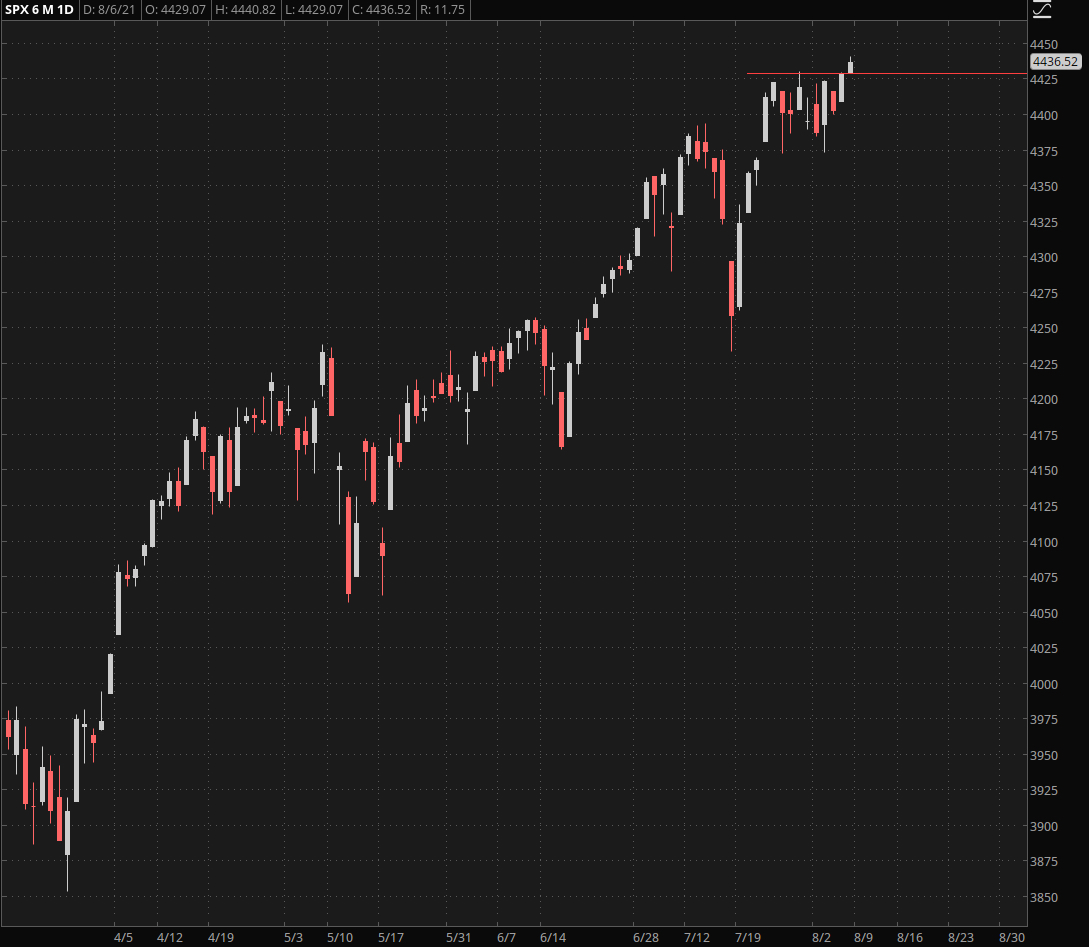
And there’s your answer – finance is what’s lifting the entire index to new ATHs. Or so you would think.
Because you would be wrong. In fact you are looking at the tail here and not the dog who’s doing all the wagging.
[MM_Member_Decision membershipId='(2|3)’]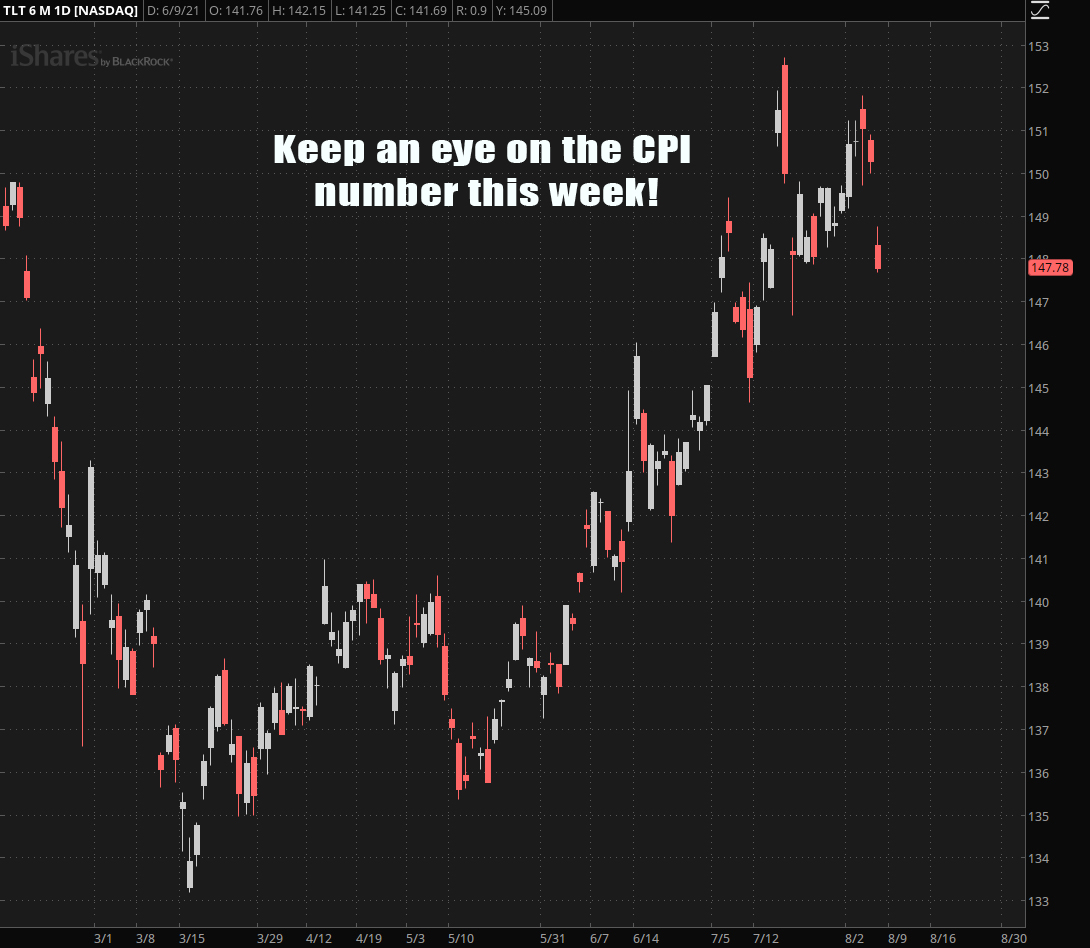
What is in fact driving this advance is the recent sell off in bonds, shown here is the TLT, a popular 20-year t-bond ETF.
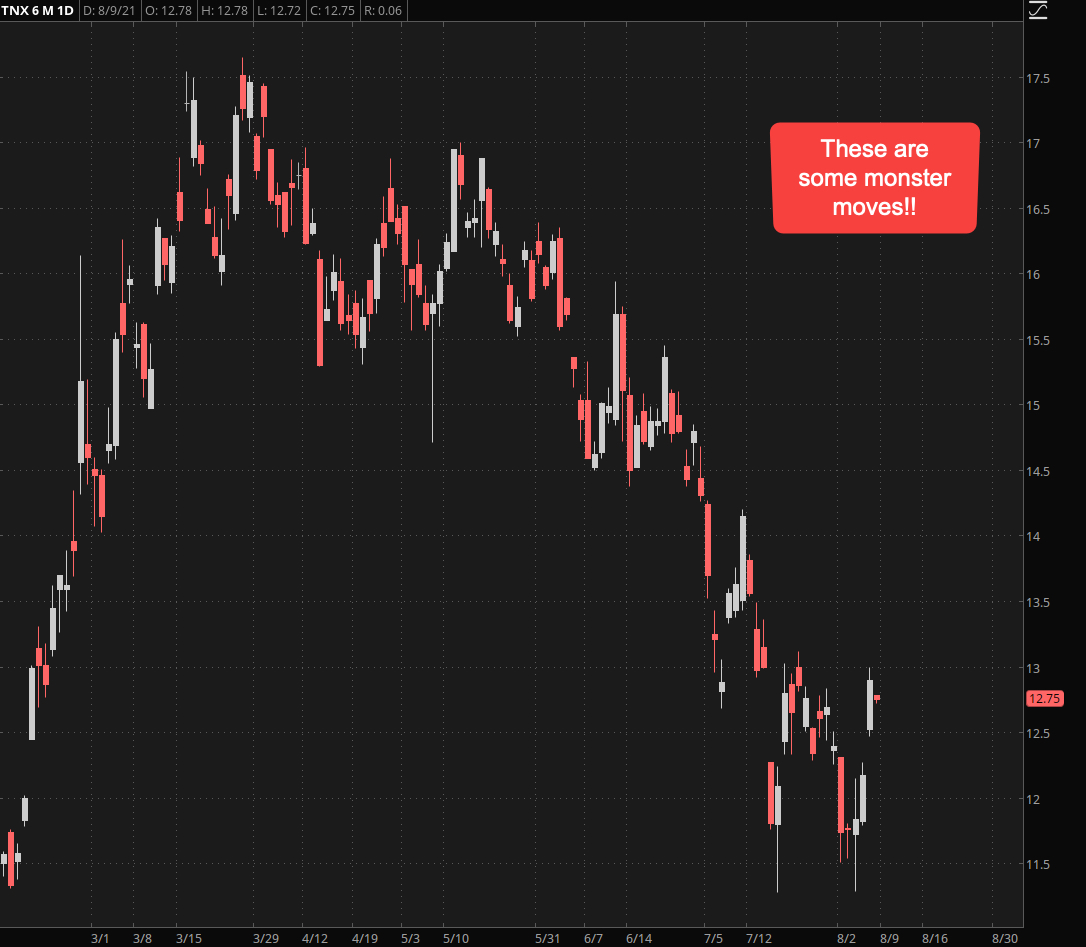
Of course when bonds are dropping then yields invariably go up. The TNX paints the rough inverse of the 10-year t-bonds and a sudden pop higher here has everyone’s attention.
So what’s the take away message here? Pretty much the same we’ve been preaching for the past few years now.
Earnings do not matter anymore, neither do revenues, or market share. The only thing that matters is what the Federal Reserve does or doesn’t do.
In the current situation the focus is on interest rates and when they may go up it’s good for finance but bad for big tech which has been benefitting from near zero interest rates to increase their own share buy backs.
As a sidenote for the uninitiated: What you see on that TNX chart is most definitely NOT your grandpa’s yield market. It’s not even your daddy’s – if he’s still around and is clued into bonds then show him this chart and he’ll straighten you out.
These are some monster moves and a 2% jump within a matter of days was once completely unheard of. How to interpret that and put into context I could try but better refrain from. Let’s just say we live in wild times.
Now here’s something else that grabbed my attention this morning. My quant buddy Tony and I have been trading VXX and UVXY for many years now and one of the recent games we’ve been perfecting has been ITM calendar spreads on both ETFs. Which henceforth shall be known as the VXX Pirate (I even have a cool eye patch on the way – no joke).
One of the juiciest opportunities for doing that is when the VXX or UVXY spike higher as they have done in recent times. When that happens we usually load up on a few ITM calendar spreads in anticipation of the front week short leg becoming worthless by expiration.
It’s a play I’ve recently been posting over on RPQ if you’re interested in tagging along.
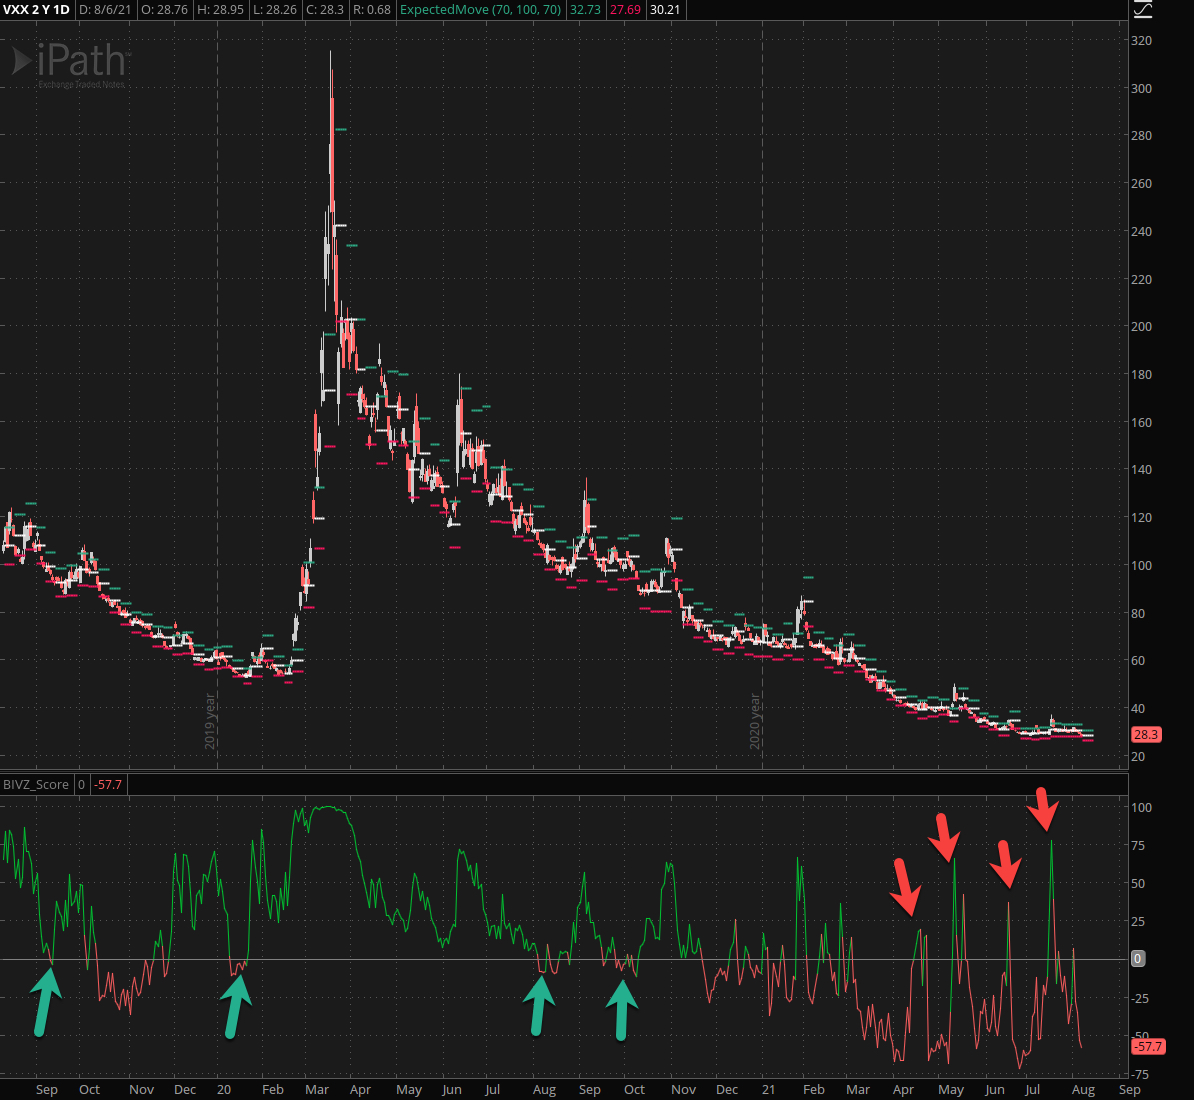
One of the things I noticed was that the zero mark on the IV-Z score behaved a bit like an oscillator. As long as implied volatility kept bounding at the zero mark going long the VXX was a nice short term play.
Most recently however I see the IV-Z score on the VXX (which is of course a split adjusted chart) behave inversely. Meaning that IV spikes above the mark are great opportunities to engage in our little VXX Pirate play. And so should you.
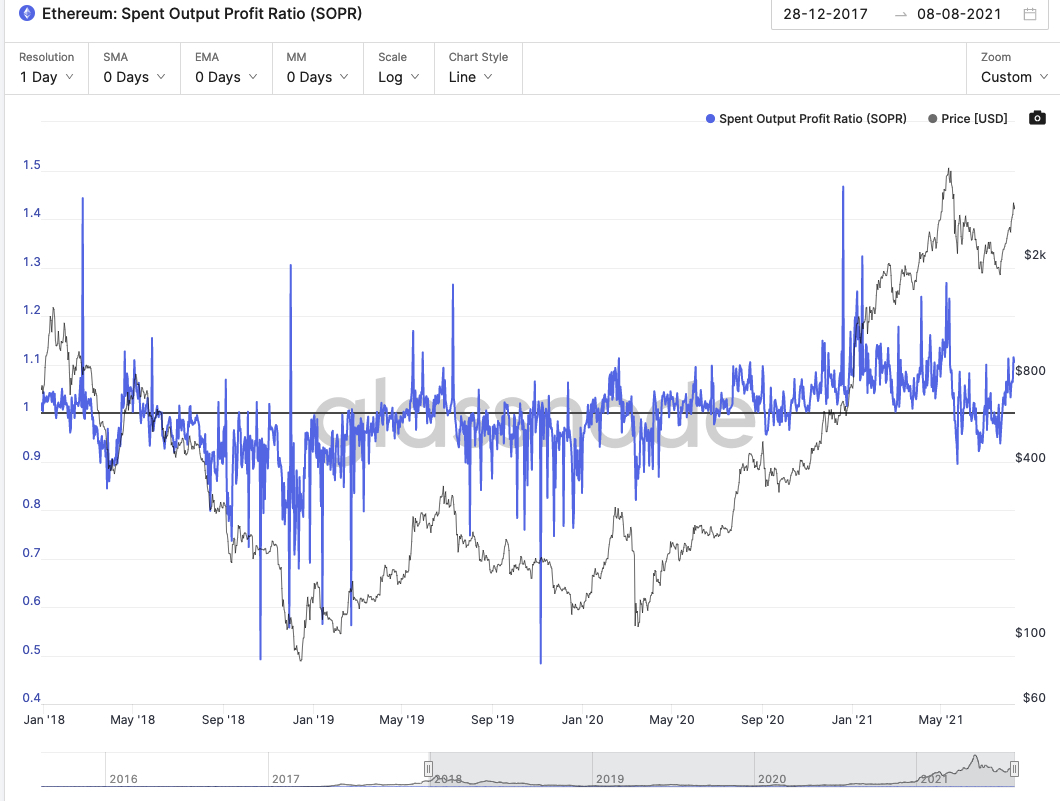
A similar observation has been made (by people much smarter than me over at Glassnode) that the SOPR on ETH acts in a similar fashion. Which doesn’t surprise me the least as it’s related in terms of its purpose – it’s a ratio.
Throughout the 2019 bear market the 1 center mark has acted as resistance but that changed in 2020 when the next bull market got off the launchpad.
Admittedly the signal had us worried for a little over the past two months but it looks like we are back in business now. We’ll know for SURE once the 1 mark once again starts acting as support.
Happy hunting but keep it frosty.
[/MM_Member_Decision] [MM_Member_Decision membershipId=’!(2|3)’] Please log into your RPQ membership in order to view the rest of this post. Not a member yet? Click here to learn more about how Red Pill Quants can help you advance your trading to the next level.[/MM_Member_Decision] [MM_Member_Decision isMember=’false’] Please log into your RPQ membership in order to view the rest of this post. Not a member yet? Click here to learn more about how Red Pill Quants can help you advance your trading to the next level.
[/MM_Member_Decision]