One of the more obscure topics I cover in my options courses is the difference between probability of expiring (POE) and the probability of touching (POT). This can be exploited by a savvy trader as the cost basis of every option is squarely based on the probability of expiring in the money (ITM). However most retail traders remain oblivious of the fact that very few ITM options will ever be held all the way into expiration.
Case in point: This week’s wide range and ensuing gyrations offered us a great opportunity to take advantage. Obviously the writing was pretty much on the wall on Tuesday at which point I sent out the following entry to my trading room subscribers:
BUY +5 BUTTERFLY SPY 100 (Weeklys) 12 MAR 21 392/394/396 CALL @.20 LMT GTC
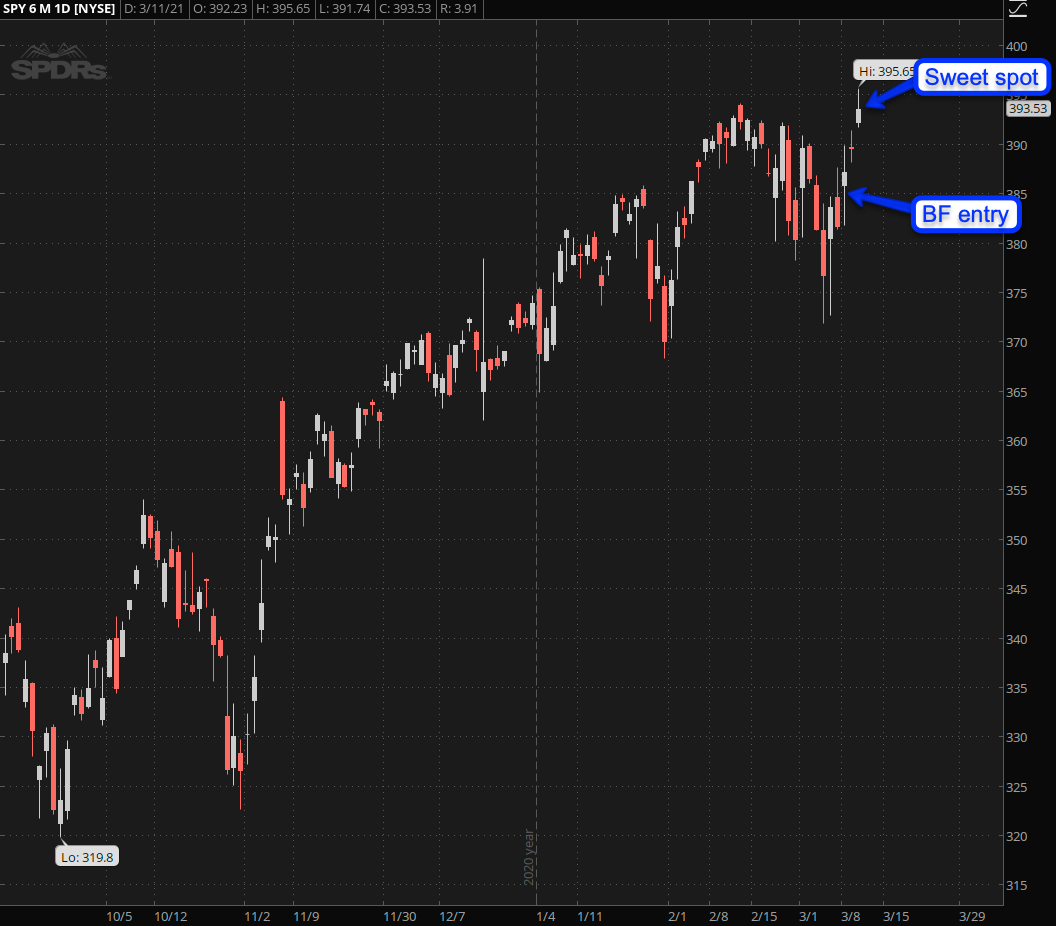
With the Spiders pushing 385 I actually overpaid as my entry was filled almost immediately. I recommended my subs to put in a stingy bid at around 18c and I bet most got filled.
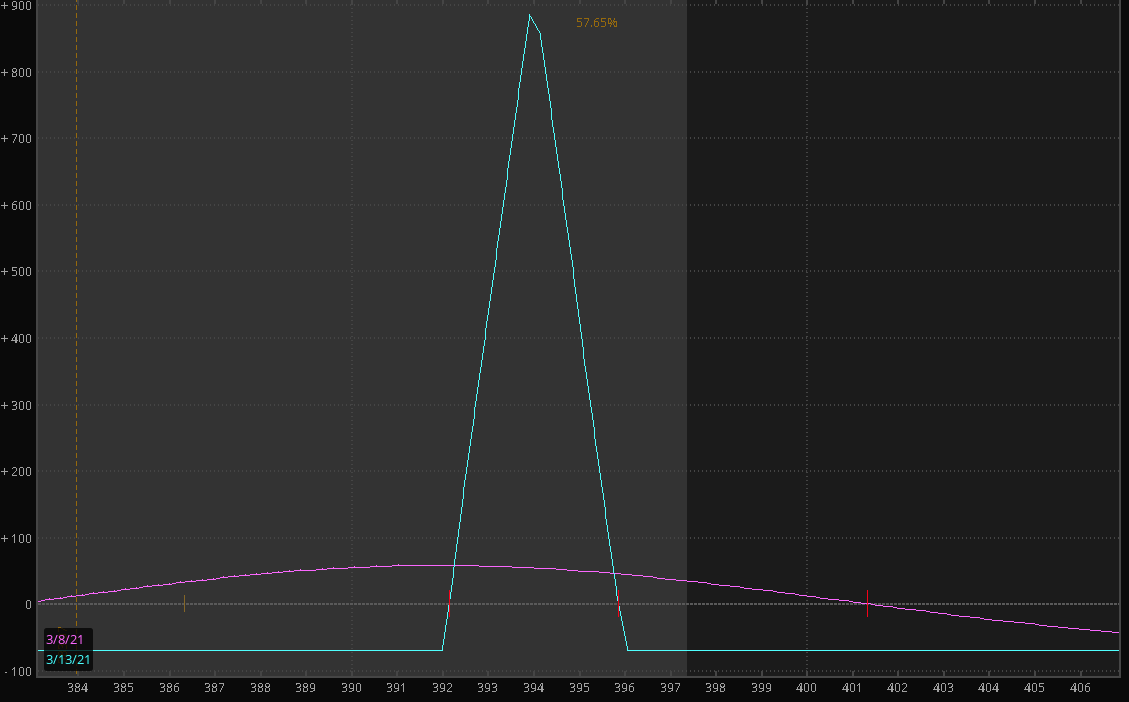
The profit graph above once again is based on POE and represents the max profit for this trade. Which you will never ever see in your entire life unless you a) manage to hit the sweet spot of 394 (the center strike) and then hold the butterfly through expiration. If you want to be assigned then that’s perfectly permissible but it’s not part of the strategy.
Clearly it’s POT we were interested in as there were about three and a half trading sessions left until expiration at the time of the entry. Which means anything can happen and that’s exactly what did happen. With the spiders trading near 394 we may be able to hit the sweet spot this week on the last trading session before expiration.
Planning The Trade
If you’re new here you may wonder why I would place a butterfly centered around the 394 mark with the SPY trading 9 handles below? Do I have magic powers? Can I foresee the future? Yes, but that’s a story for a different day.
Rather I know a thing or two about statistics and the stats tell me that the SPY has a high probability of closing near its upper or lower expected move on a weekly basis. Not EVERY single week and obviously not in the past few weeks, but as a whole it is an edge that has remained consistent since about 2016 with the proliferation of weekly options.
Knowing that, and given that we already had scraped the lower expected move threshold on Monday this was a low hanging fruit ready for the plucking. Again if you are interested in learning how to place EM Butterflies then look no further than my Options 201 course which you can find over in the Academy.
Now let’s talk about this crazy market – things are getting very exciting:
[MM_Member_Decision membershipId='(2|3)’]With equities at all time highs what I’m mainly interested who’s leading and who’s lagging. Well, the answer to that is very few sectors are lagging and the rising tide appears to have lifted all boats.
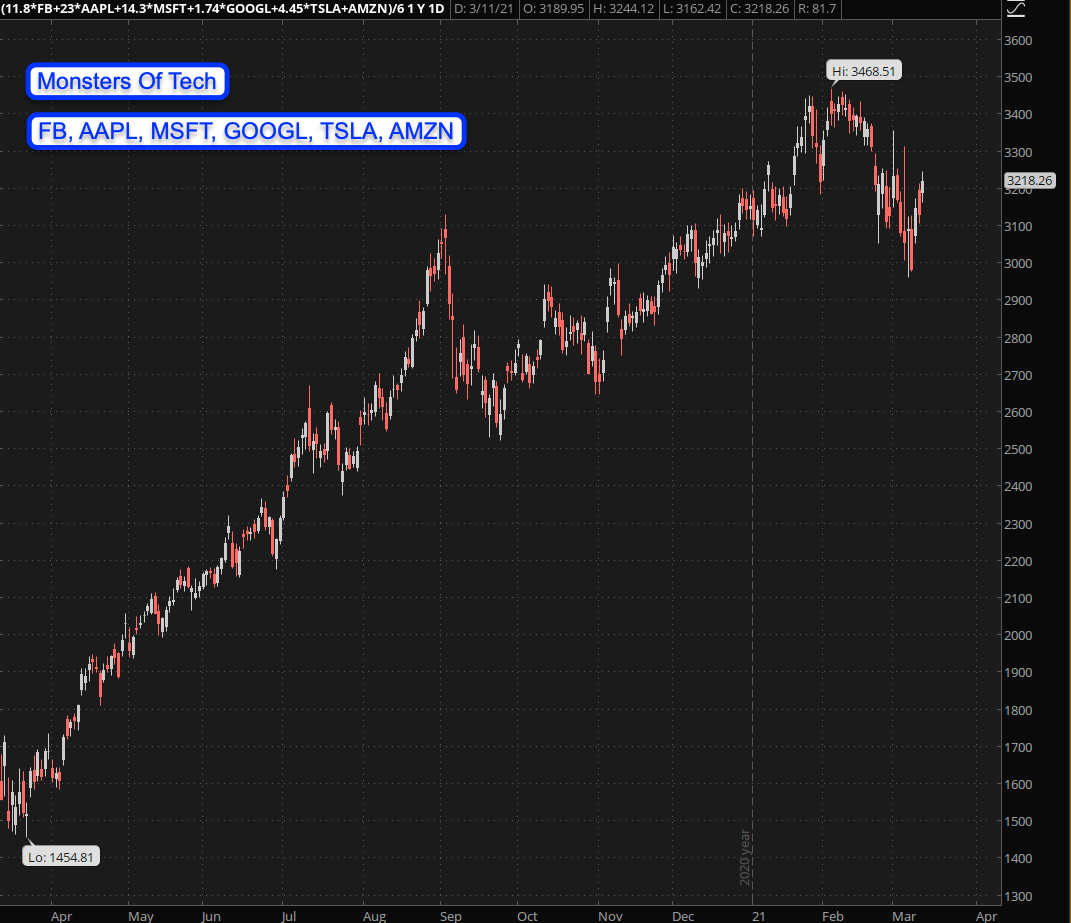
I recently included TSLA into the monsters of tech which does a pretty good job of smoothing things out a bit more. Obviously we’re seeing a bid here and it’s not surprising as we expected rotation into technology after what looked like a thorough HV corrective phase.
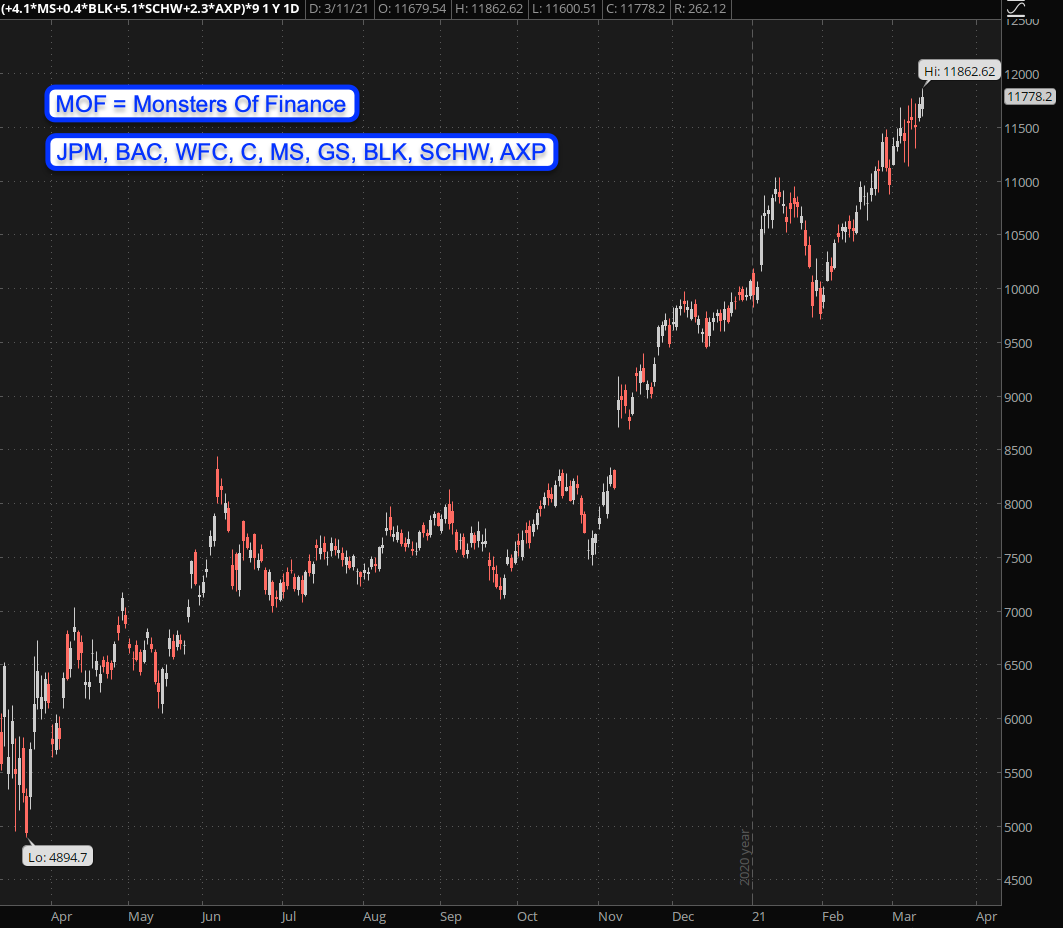
What surprises me however is the financial sector which continues its gangbusters run to the upside. The FXE is a big gappy and I decided to put together my brand spanking new ‘monsters of finance’ composite, which looks a lot more orderly and summarizes the types of symbols in this sector I actually enjoy trading.
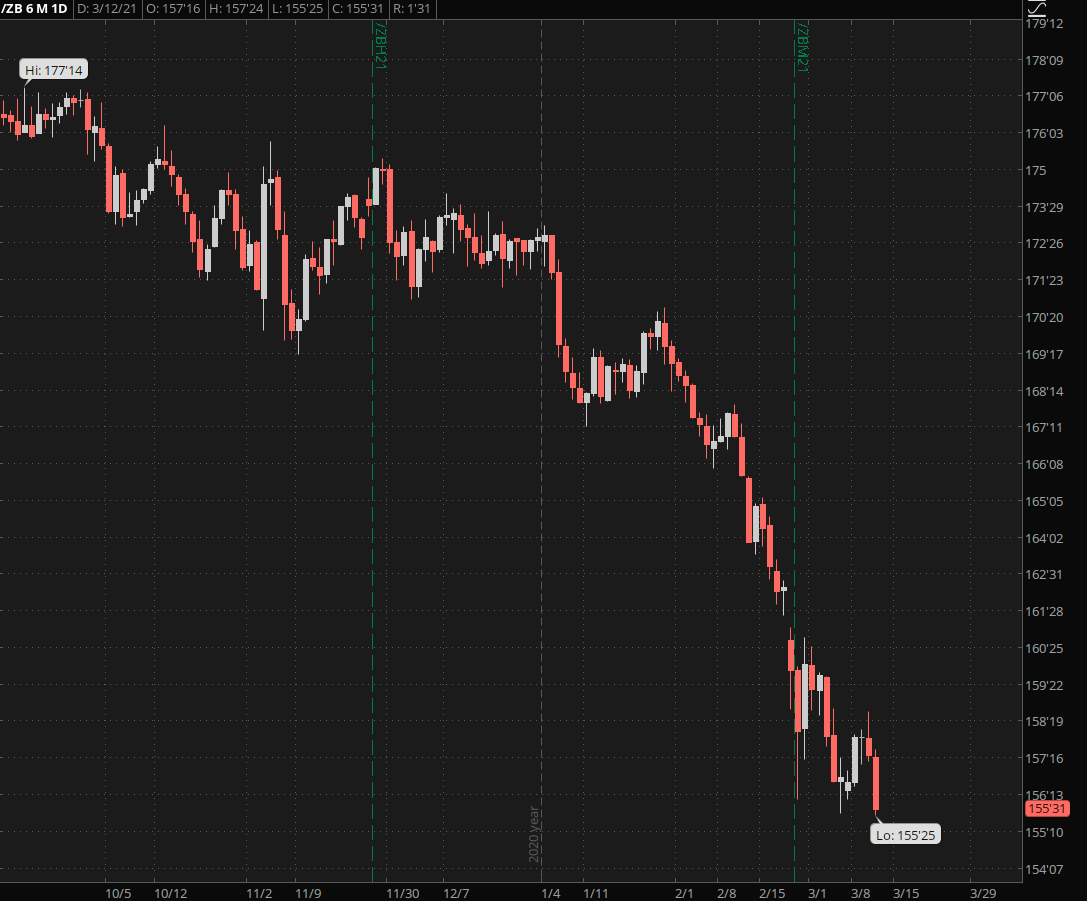
With bonds falling like a rock it’s puzzling to me that we don’t see financials slowing down. And the fact that they are rallying higher is a bit puzzling to me. Which however brings me the core of the issue:
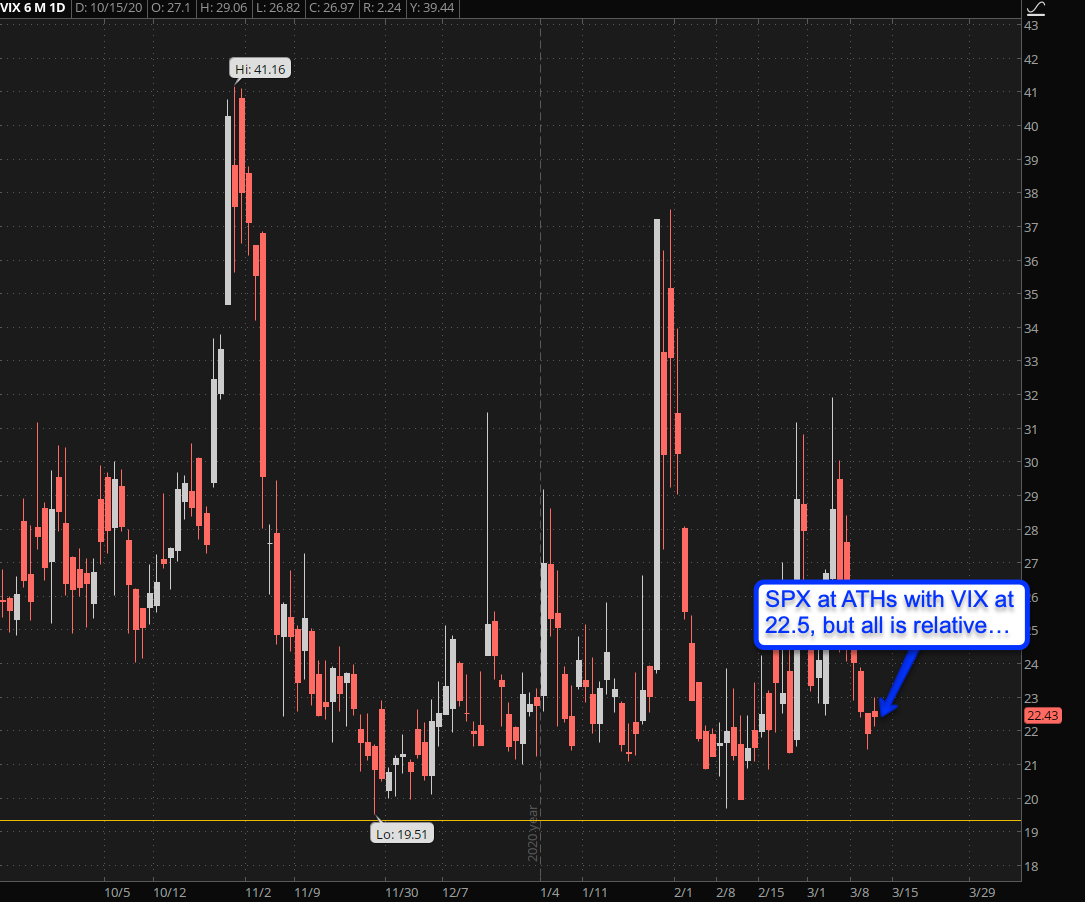
So everything is pushing higher (except bonds and gold [told ya!]) and the SPX just painted new all time highs. Meanwhile the VIX has dropped quite a bit but hey – we are at the 22.5 mark!
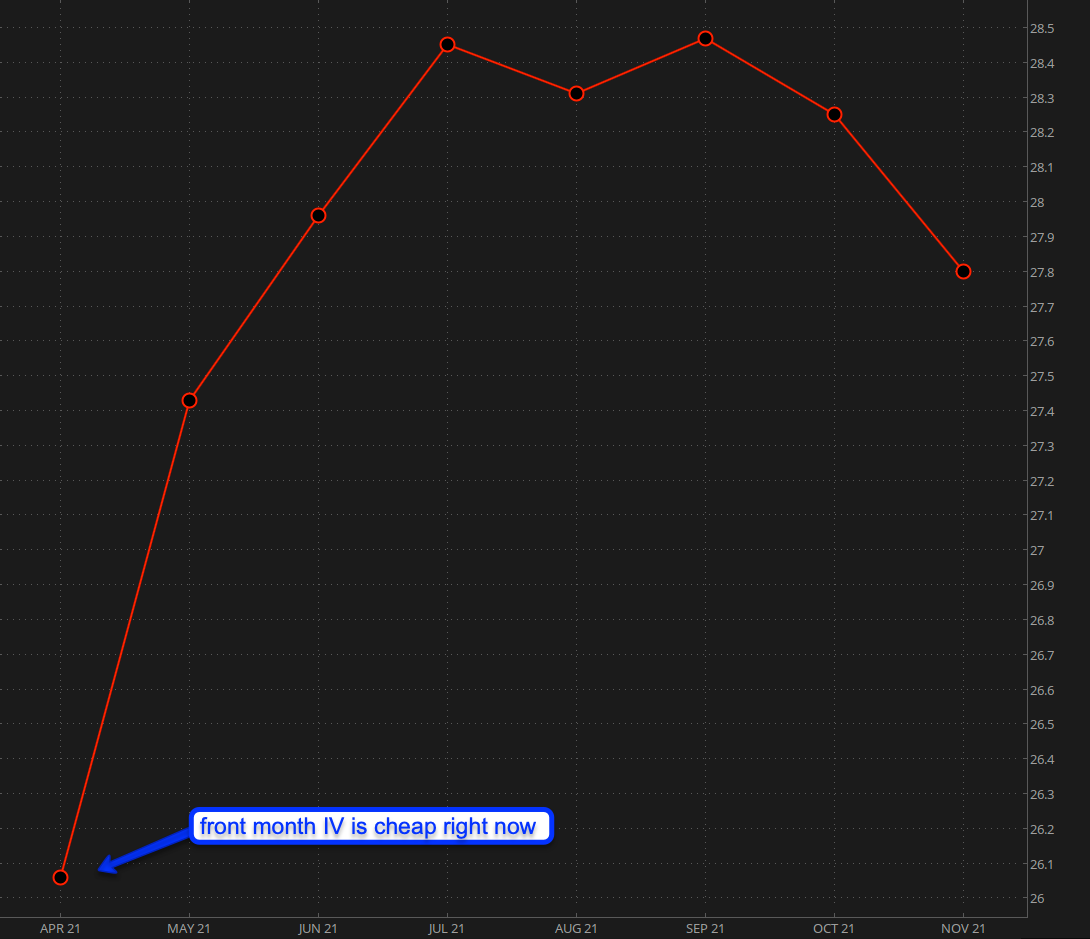
Which may have been surprising prior to 2020 but I guess not in the ‘new normal’ everyone seems so eager to celebrate. Be this as it may – it’s actually CHEAP! Because looking further out the VX is already scraping 26 in may and then rises all the way into 28 by summer.
Will we see a big correction as we push into spring and early summer? Heck – I don’t know and neither do you. But what we DO know is that front month IV is cheap in comparison with back month IV and we shall seek to exploit that fact. Stay tuned.
[/MM_Member_Decision] [MM_Member_Decision membershipId=’!(2|3)’] Please log into your RPQ membership in order to view the rest of this post. Not a member yet? Click here to learn more about how Red Pill Quants can help you advance your trading to the next level.[/MM_Member_Decision] [MM_Member_Decision isMember=’false’] Please log into your RPQ membership in order to view the rest of this post. Not a member yet? Click here to learn more about how Red Pill Quants can help you advance your trading to the next level.
[/MM_Member_Decision]


