It’s a short trading week and on average they do tend to be a bit sleepy due to a lack in participation. This was evidenced by the reduced weekly trading range stats I posted on Monday. However the gyrations we’ve seen thus far are tantamount to running in circles, which potentially opens up some interesting low probability profit opportunities for us.
While I’m the first one to point out that there’s a stark difference between trading and gambling I am not opposed to taking on a low probability high payoff trade, especially when I feel that the odds are in my favor. Before we get to all that let’s set the stage:
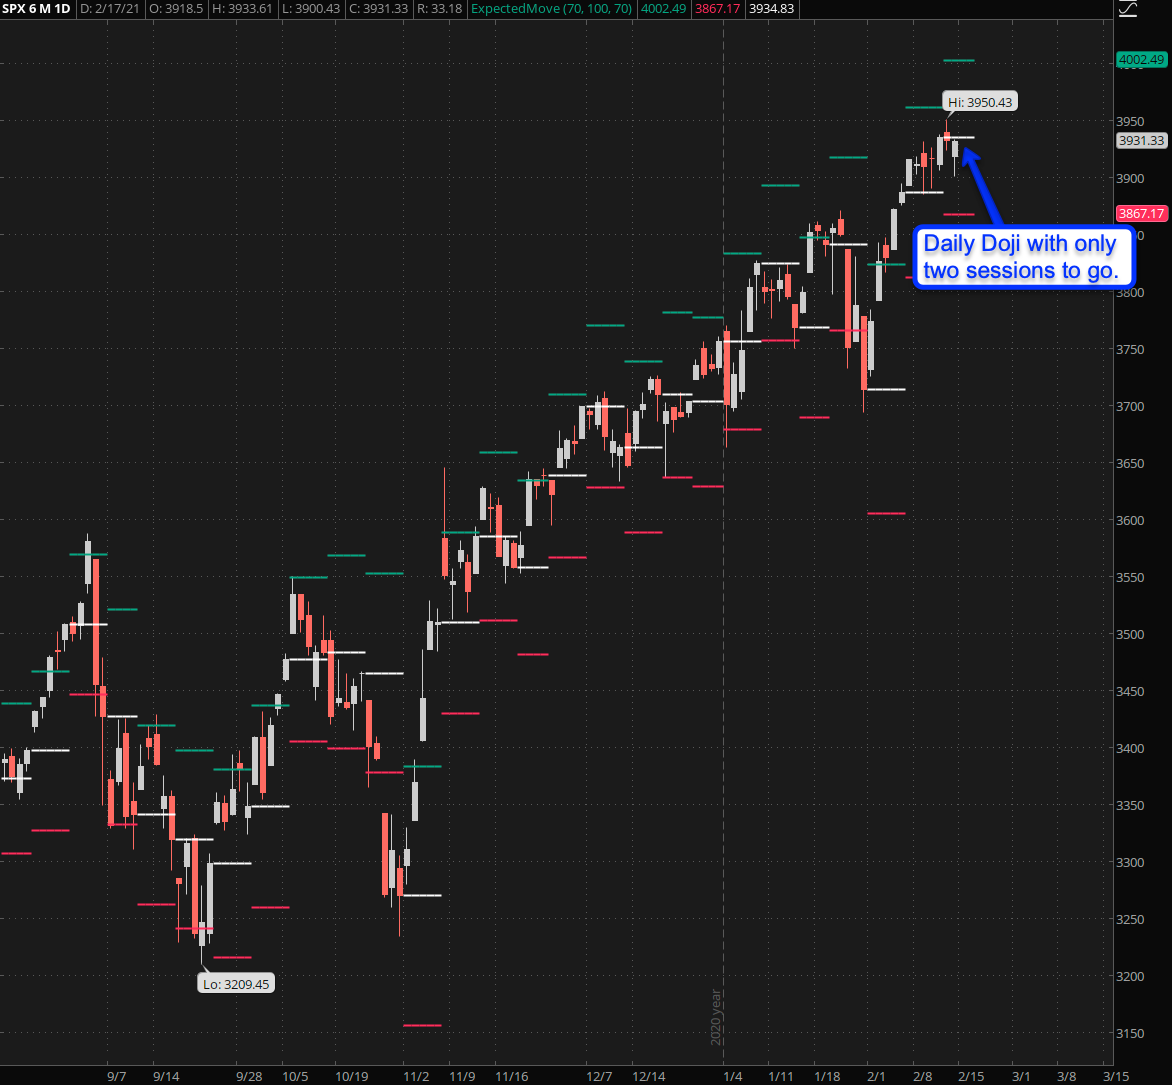
As of now the SPX is painting a daily doji (minimal body with long wicks) with roughly sixty handles in expected move to the up and downside and only two more full trading sessions to go.
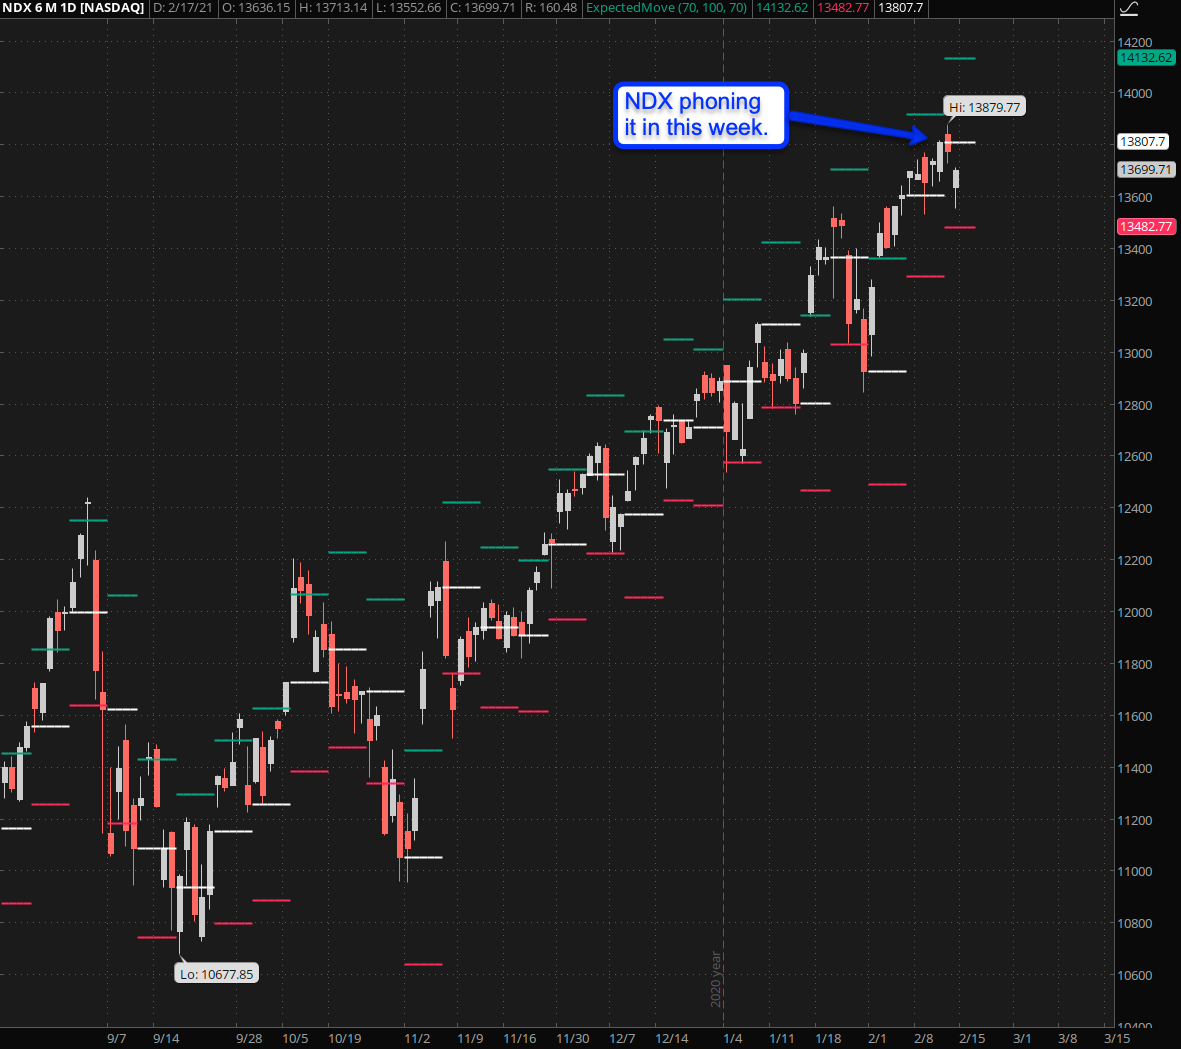
The NDX is sort of phoning it in this week and doesn’t seem to have a clue as to where it wants to go. This is to no doubt caused by the sideways gyrations we have seen in the monsters of tech over the course of the past month.
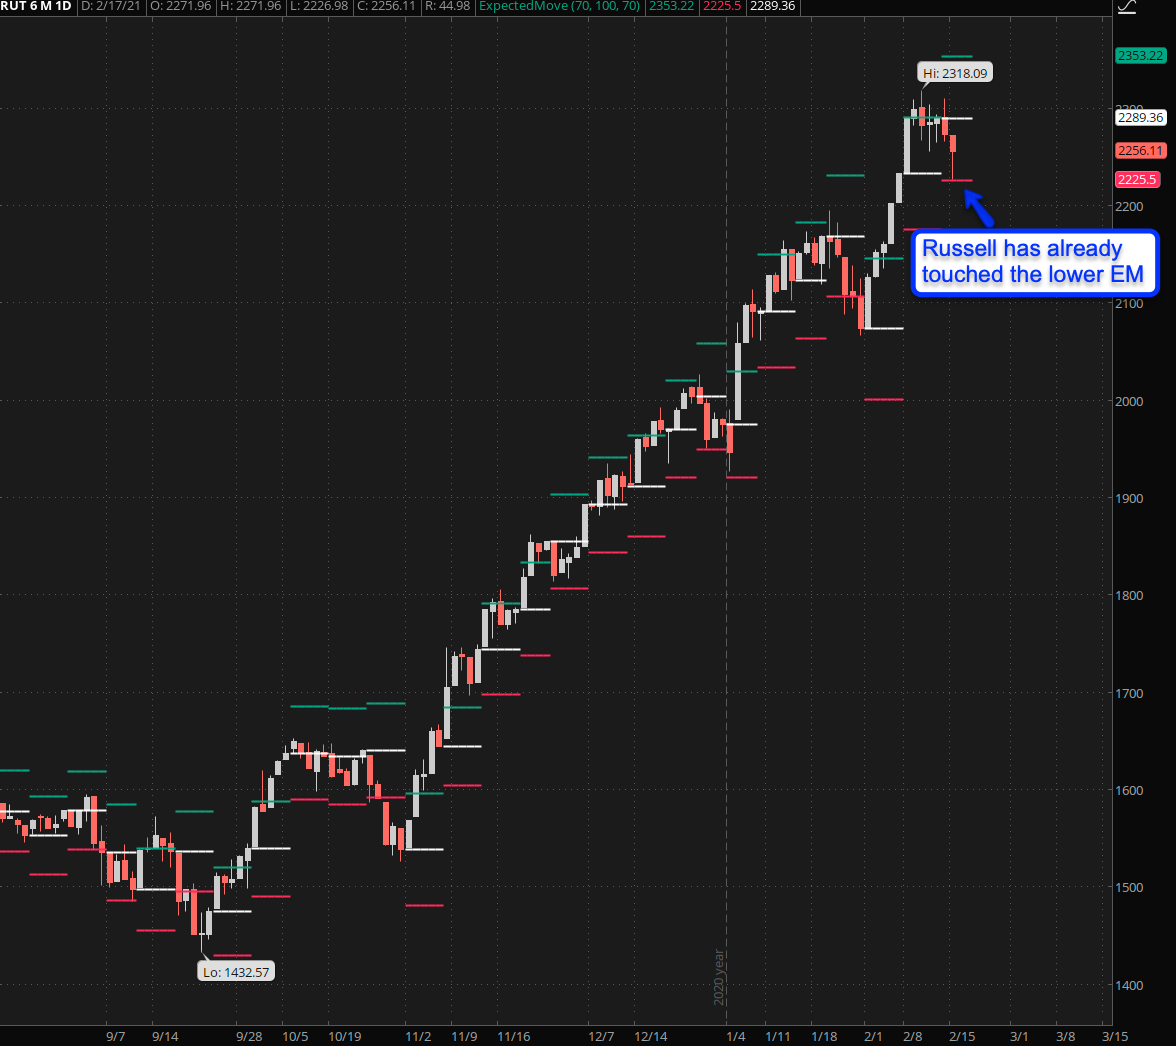
Also if you look closer, and compare it for example with the RUT below, then you’ll see a LOT of gapping action which does not suggest a highly volatile and somewhat erratic market.
The Russell – having run on rocket fuel since early November surprised a little bit as the weakest of the litter but it thus far has been able to hold its own lower EM near 2225.5.
So after reviewing all the above Baldrick, my new financial analyst, proposed a cunning plan:
[MM_Member_Decision membershipId='(2|3)’]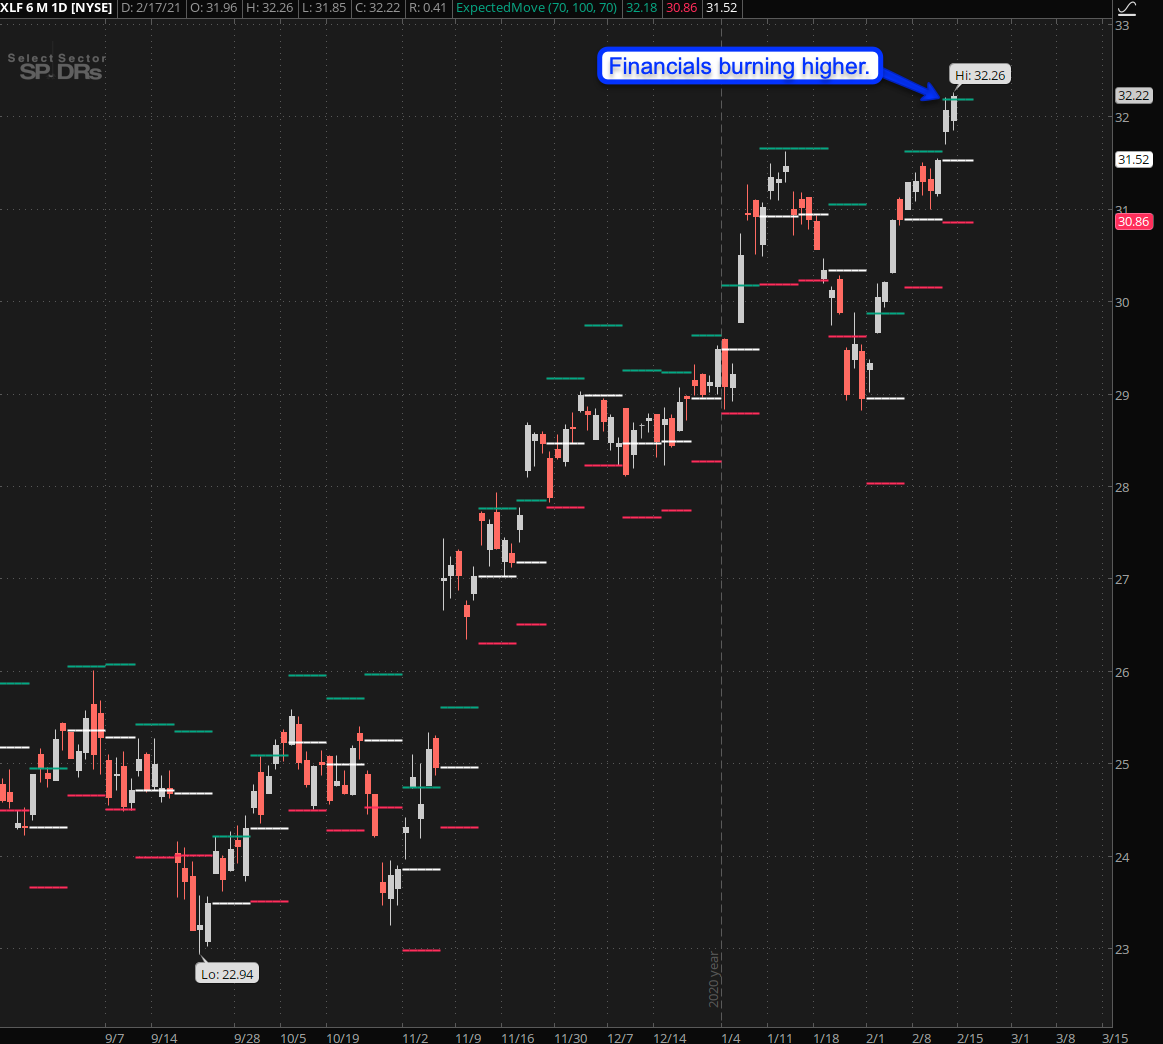
What’s mostly been driving the market from mid January until now has been the financials – as nicely shown above by the XLF. It’s been burning higher with utter disregard to all the naysayers. I hate the banksters as much as the next guy but when it’s driving the market higher I want a piece of that action!
Hypothesis
Which brings us to our nefarious but low probability swing to the fences. If you take another look at the first chart I posted above (the SPX) then you’ll see that it has exhibited a strong bias toward closing at or near its weekly expected move.
With only two more days to go the OTM weekly options are expiring on the 18th are now available at bottom bargain prices:
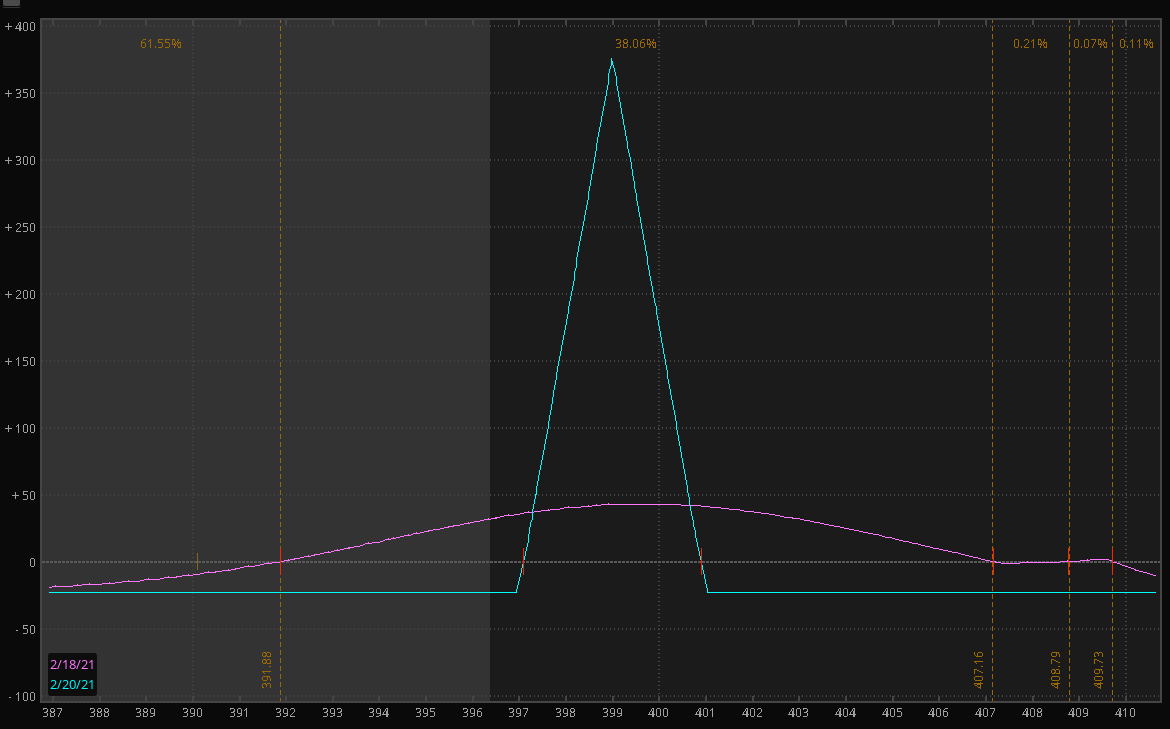
And that’s where I come in. For 7 cents plus/minus I’m grabbing myself a few butterfly spreads centered around the 399 mark. It’s an easy trade and risk is limited to your debit.
Here’s the profit/loss graph, which can’t be taken seriously as it’s based on the actual day of expiry. Unless the Spiders close the week lightyears away make sure to sell this sucker back.
For your convenience here’s a string you can copy/paste into your TOS platform as shown in my Options 101 and Options 201 courses:
BUY +1 BUTTERFLY SPY 100 19 FEB 21 397/399/401 CALL @.07 LMT
That’s for only one single butterfly, if you want to grab more (I’ve got 10) then make sure to increase the quantity.
BTW, if you are NOT on ThinkOrSwim then here’s a very nifty tool I’ve coded up that will help you ‘translate’ the order string into human readable language. Then you can go ahead and place your trade on any platform you like.
UPDATE 10:00am EST: With the market opening lower I’ll grab a few more of these guys:
BUY +10 BUTTERFLY SPY 100 19 FEB 21 397/399/401 CALL @.02 LMT
Odds are minimal at this point of course but they are dirt cheap. I’m also grabbing a few put butterflies:
BUY +5 BUTTERFLY SPY 100 19 FEB 21 388/386/384 PUT @.18 LMT
[/MM_Member_Decision] [MM_Member_Decision membershipId=’!(2|3)’] Please log into your RPQ membership in order to view the rest of this post. Not a member yet? Click here to learn more about how Red Pill Quants can help you advance your trading to the next level.[/MM_Member_Decision] [MM_Member_Decision isMember=’false’] Please log into your RPQ membership in order to view the rest of this post. Not a member yet? Click here to learn more about how Red Pill Quants can help you advance your trading to the next level.
[/MM_Member_Decision]


