For all intents and purposes 2020 has already been the most contentious and violent U.S. election season in living memory. With a nation in a state of a cold civil war one would assume that the financial markets would take note. And under the hood they did indeed respond by keeping implied volatility elevated throughout the year. However, with the exception of a much overdue correction earlier this month we currently seem to be in a pre-election holding pattern. What should we make of that and where are we heading next?
One of the first things I do each Sunday is to review the option chain on the SPX for the foreseeable future. This tells me a lot more about the general sentiment among market participants and it also allows me to spot looming periods of instability, if there are any.
Throughout 2020 that exercise quickly turned a into a game of whack-a-mole as one crisis or political drama seems to be chasing the next. However with the presidential elections only a bagel throw away my initial assumption was that we would be seeing some level of normalization going into the new year.
Boy was I wrong.
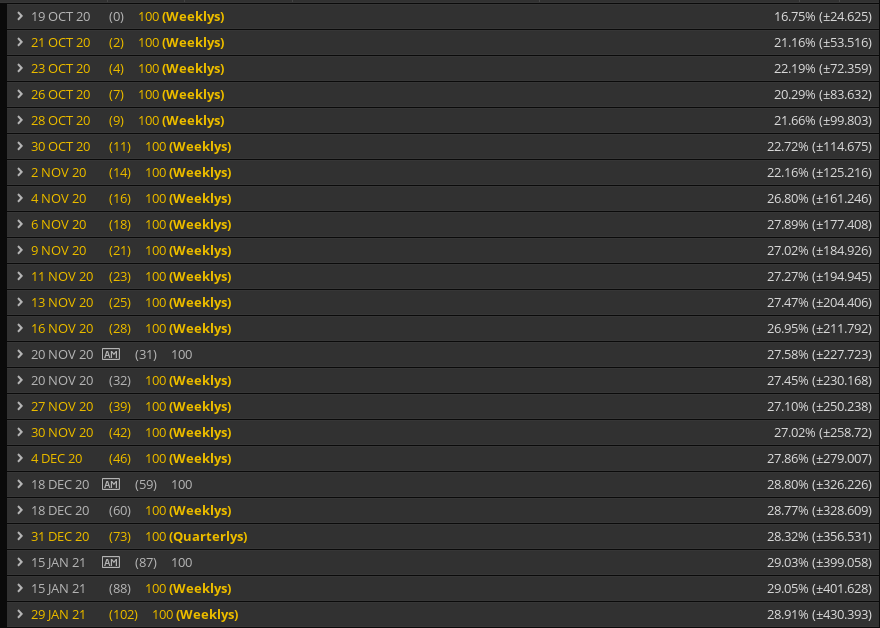
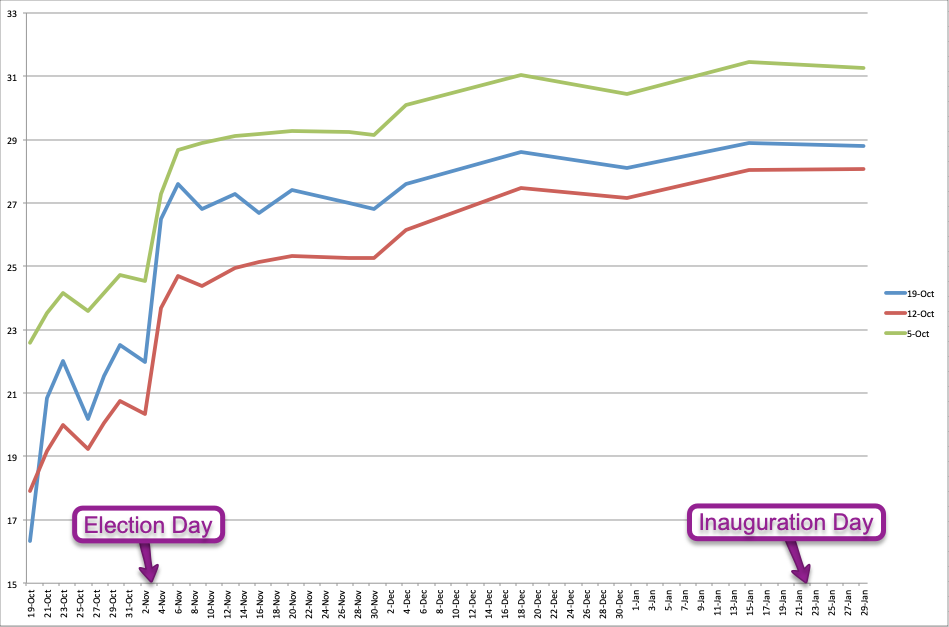
Not only is implied volatility expanding significantly into election day but has consistently remained so going into the new year. Which tells us quite a bit about at least the perception surrounding the pre and post election day chaos that we are heading into.
While implied volatility seems to be waning and waxing across the chain on a weekly basis (see Monday readings above) the overall trend has remained very consistent. We are seeing a marked jump in IV for the Nov 4th expiration which is the day after the presidential elections.
What that tells us is that the general public expects a drawn out and contentious post-election process which may in fact extend all the way into January and perhaps beyond.
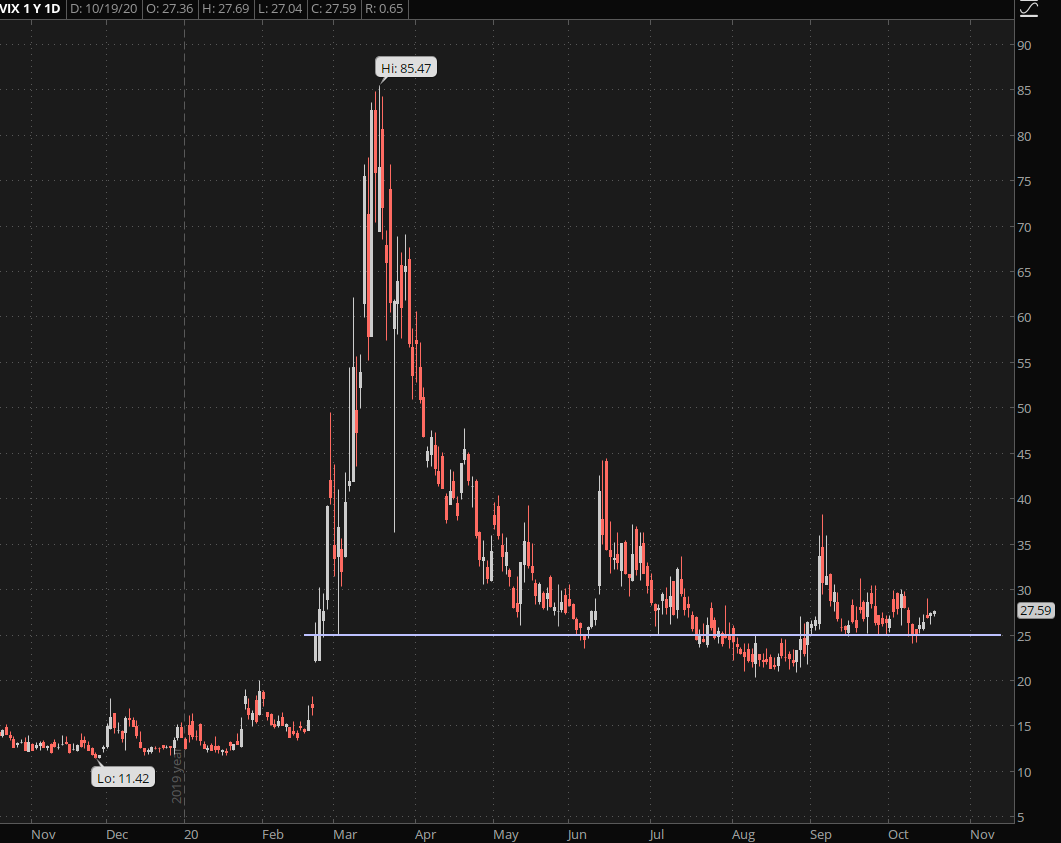
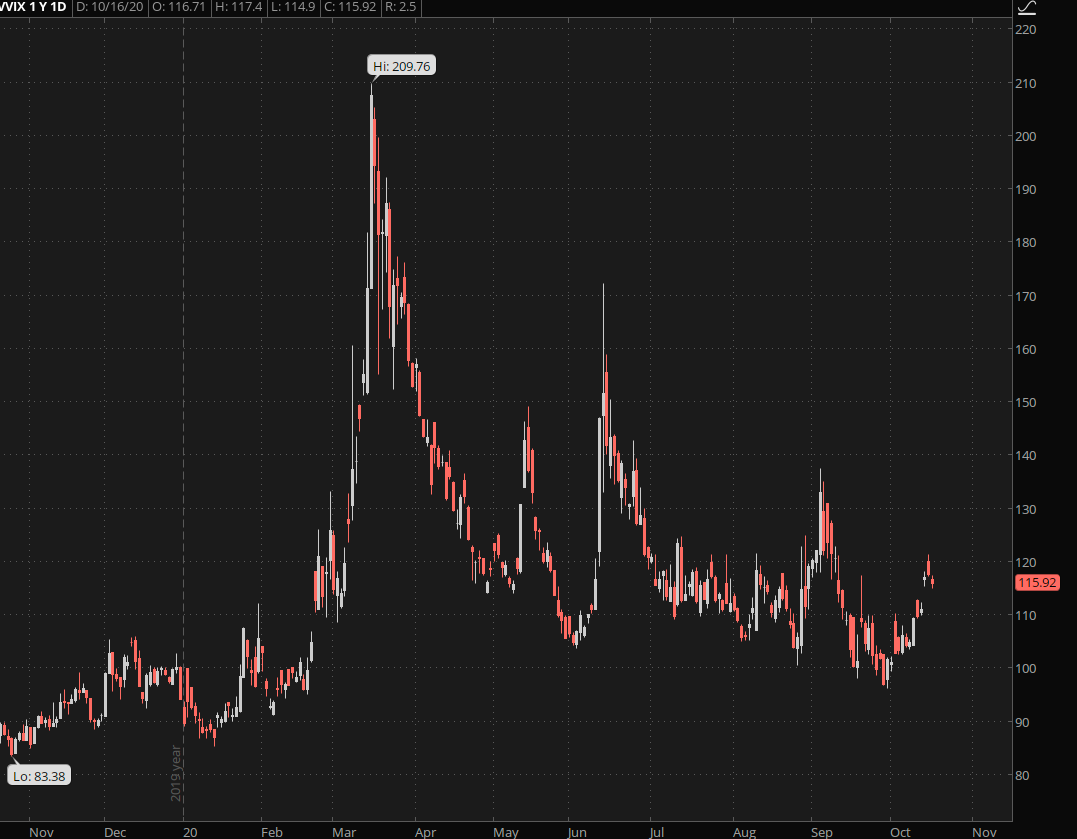
Now clearly the VIX has been taking notice and I don’t expect that baseline near 25 be taken out anytime soon. In fact given where we’ve been since mid February of this year we are currently scraping the bottom of the barrel if you count out the late summer swing toward the 20 mark which was quickly remedied in September.
Not surprisingly the VVIX – realized volatility of implied volatility – is on the advance and will most likely remain elevated all the way through election day. Only an extremely one sided election result, e.g. 60%+ Biden or Trump – meaning a blue or red wave, would change the dynamics here.
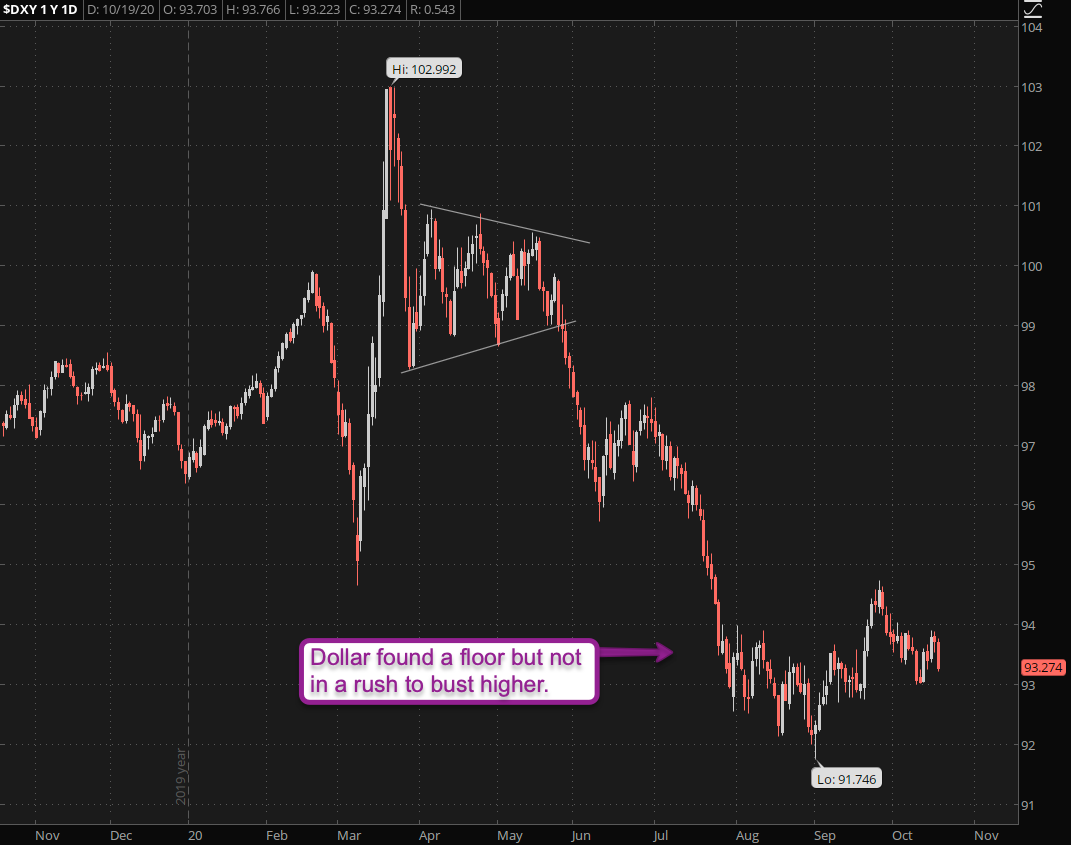
The other chart you want to probably keep an eye on is the Dollar. It’s been stabilizing somewhat over the past few months and appears to be in the process of painting a medium term floor pattern. However a sudden jump here as well as in the bonds would give me reason to consider taking out a few speculative OTM puts in equities. After all IV is still relatively cheap right now.
However there is one particular sector that I consider most likely to be the most exciting trading opportunity of the year:
[MM_Member_Decision membershipId='(2|3)’]
If you’ve paid attention over the past few months then you probably have guessed it already: The ‘monsters of tech’ which I’ve combined into a composite symbol in the chart above.
After enjoying their final day in the sun in early September it’s been a rough ride ever since with wild swings in both directions. It’s clear that the outcome of this election will have significant impact on the future of big tech.
President Trump has minced no words when it comes to his plan to revoke section 230 which currently protects tech companies like Google, Twitter, and Facebook from prosecution. Although I have my doubts that Congress would ever pass a pertinent bill anytime soon at least this opens up juicy trading opportunity based on these two simple scenarios:
- Biden wins and the entire sector jumps significantly.
- Trump wins and the entire sector drops significantly.
It’s really that simple – I don’t see much grayscale here. A decisive win by any candidate will move big tech by at least 2 standard deviations (expected move * 2) and I plan on placing a good number of OTM iron condors in preparation.
If you missed my Friday post on that subject please go back and read it as it’ll give the gist of the idea ahead of a pertinent video series I have planned for late this year.
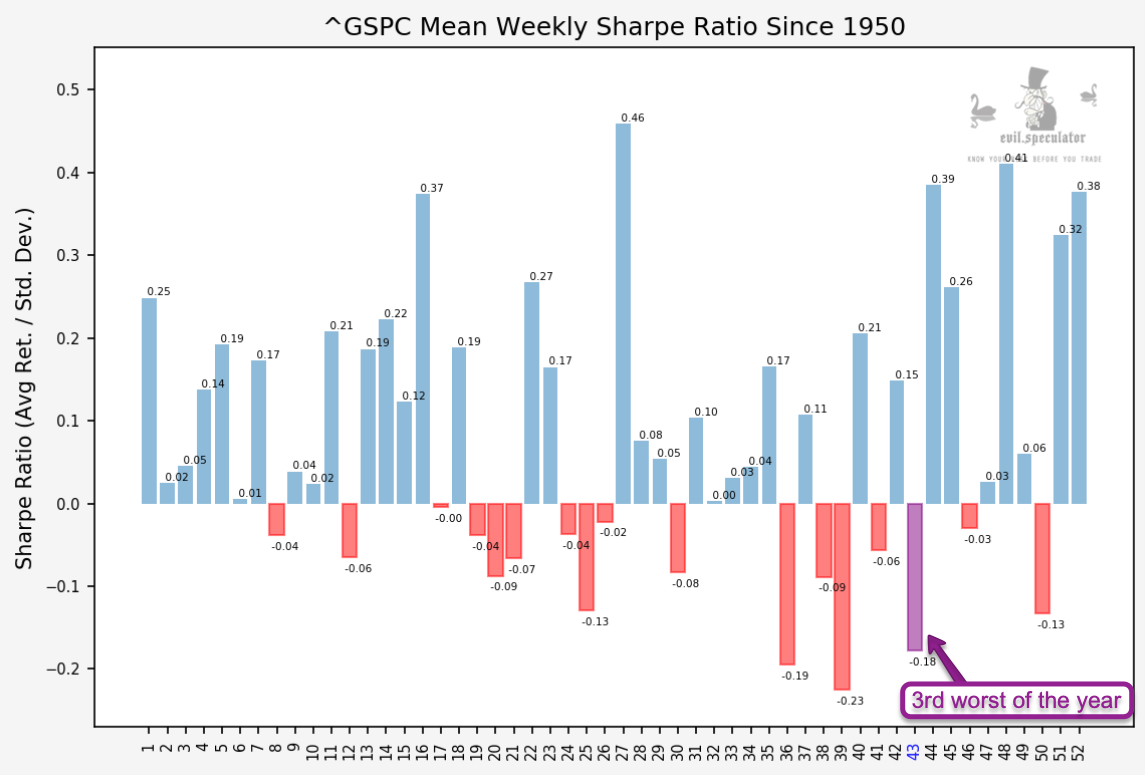
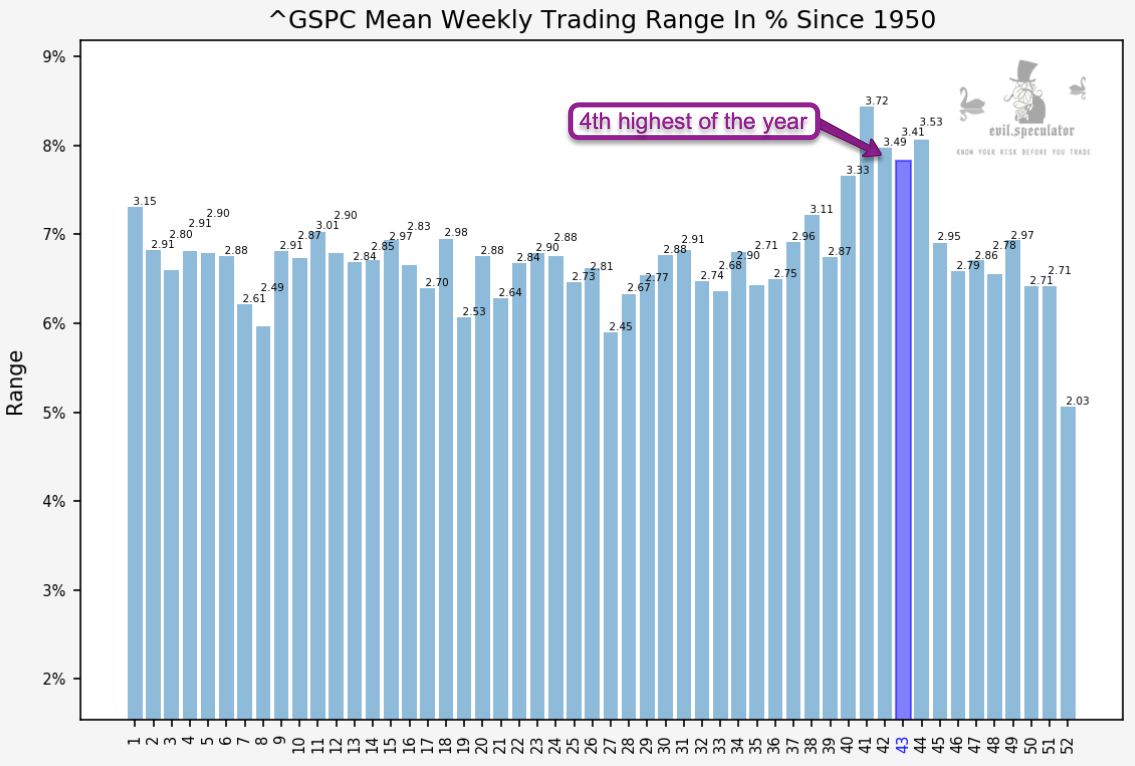
Now let’s talk weekly stats. They are not looking so hot for week #43 – in fact the Sharpe ratio is the 3rd worst of the year. That’s of course never a prediction but it gives you the seasonal bias, which is always worth considering.
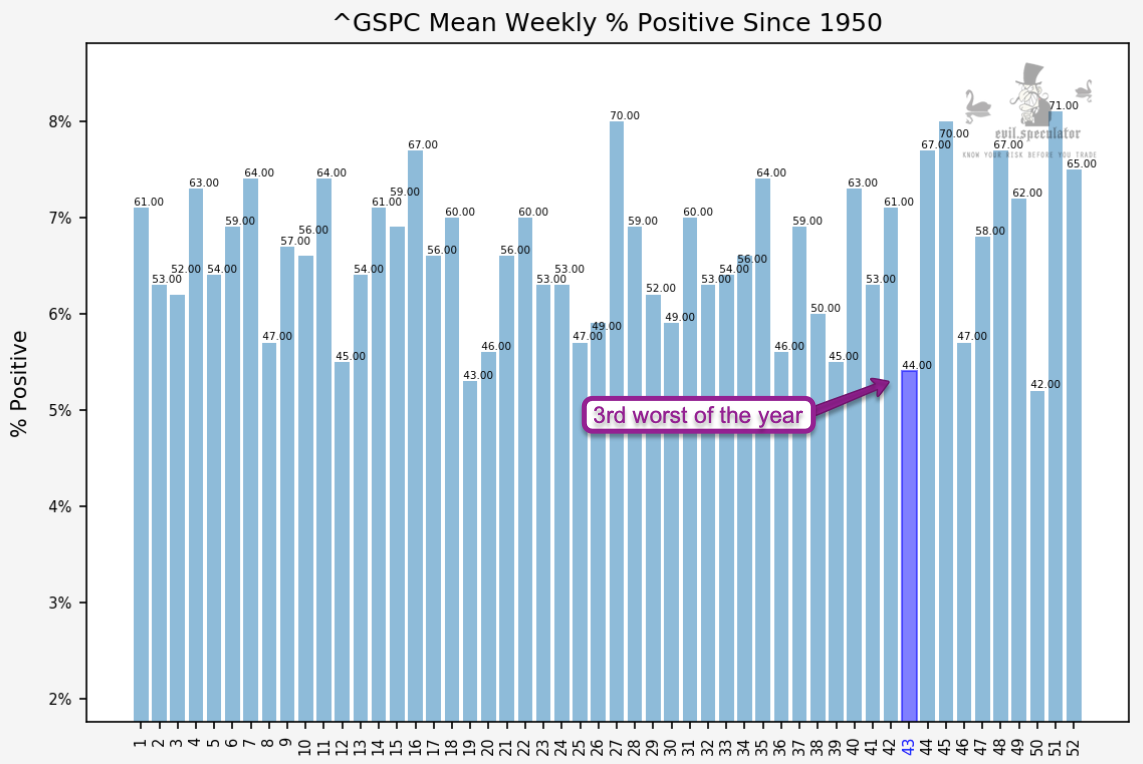
Percent positive is the 3rd worst as well. Oh boy…
Trading range on the other hand is the 4th best!! I’m only sort of kidding as this may be a great week for swing traders. In fact these stats – being non-directional – are probably more reliable than anything else.
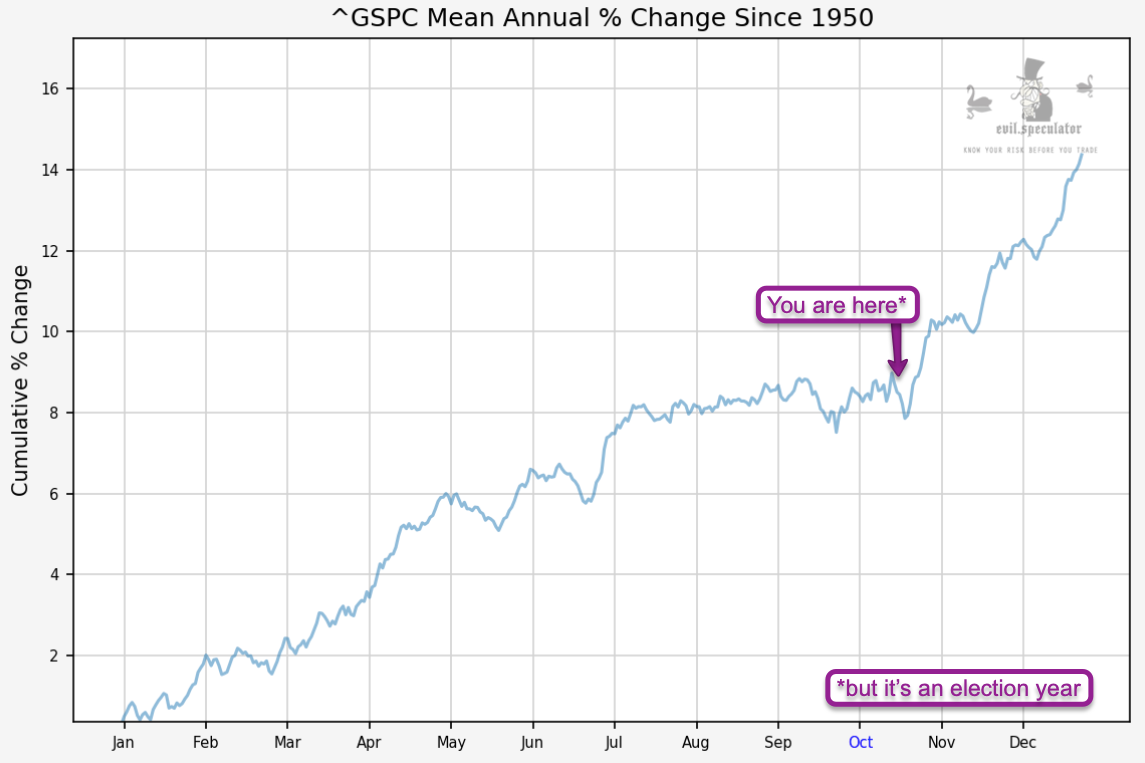
So here we ‘would be’ on an average annual basis if it wasn’t an election year. Frankly given what we are heading into I have my doubts about the Santa Season. But then again, it’s not that months of cities being lit on fire had much of an affect, so at least on the trading front we may be okay. When it comes to all the rest – all bets are off I guess.
Happy hunting but keep it frosty.
[/MM_Member_Decision] [MM_Member_Decision membershipId=’!(2|3)’] Please log into your RPQ membership in order to view the rest of this post. Not a member yet? Click here to learn more about how Red Pill Quants can help you advance your trading to the next level.
[/MM_Member_Decision] [MM_Member_Decision isMember=’false’] Please log into your RPQ membership in order to view the rest of this post. Not a member yet? Click here to learn more about how Red Pill Quants can help you advance your trading to the next level.
[/MM_Member_Decision]

