Something pretty interesting happened over the weekend as I was cruising Airbnb for potential weekend get-aways here on the Iberian Peninsula. Since I’ve always been a stingy bastard I’m not ashamed to admit that I was pretty perplexed by the exorbitant prices that I simply couldn’t square with the glaring lack of demand in tourism Spain currently is experiencing. Part of that of course is due to recurring and erratic COVID-19 lock downs and various other entry restrictions here in Europe. But some of it is also purely self-inflicted as excessive price gouging over the past years already started to be a topic of contention among visitors back in 2019.
However that’s not the interesting part just yet. What I found extremely puzzling was the fact that almost all of the places I was considering were available for at least a month or two out. At first I had naively imagined that we should be able to snap up a juicy deal given that the vast majority of active tourism in Spain right now is domestic, meaning Spaniards (who on average earn a lot less than their Northern Europeans neighbors) traveling inside of Spain.
Boy, was I in for a rude awakening. Anything I would consider borderline acceptable started at around €150/night (~$180), which is actually higher than the average price I observed in the past year or two. So just out of curiosity I began to expand my search window from a few days to a full month, which I believe is the limit for Airbnb.
Sure enough most of those same properties were wide open and available to be rented, clearly suggesting that overall demand was not in line with the pricing. In other words, for whatever reason property owners here in Spain continue to cling to high rental fees despite the fact that very few if anyone is taking them up on their offer.
Clinging To The Rosy Past?
I have often talked about human psychology and cognitive biases which have become an avid interest of mine since I started to trade and write about trading for a living over twelve years ago. So it’s not exactly a new topic for me, and neither are the laundry list of behavioral biases I encounter on an ongoing basis, in trading of course but also in real life.
But I have to concede that pertinent observations never cease to surprise me, especially when they are so glaring. Here we have a country that is clearly heading straight into a decade long economic recession, perhaps bordering a generational depression with mass unemployment as well as demographic, political, and civic upheaval.
Nevertheless it seems that, at least in the eyes of the average Spanish Airbnb host, it’s business as usual in expectation of holiday suckers abound willing to plunk down top Dollar – or in this case top Euro – for what I would consider rather average looking, badly maintained, and poorly furnished rental properties without amenities or WiFi access.
The three mental hangups that come to mind – and which I have talked about repeatedly here over the past years are:
- Status Quo Bias – doing nothing or maintaining a previous decision when instead a change should be made (Kahnemann 1991).
- Herding Bias – trading (or operating) on the same side of the market in the same securities, ignoring conflicting information in favor of acting as other investors do, often for reassurance and comfort (Grinblatt 1995).
- Cognitive Dissonance – mental discomfort that result when confronted by new information that conflicts with existing beliefs or ideas.
Clearly all three apply here to some extend and I only elected ‘herding bias’ as the theme since it made for the best featured image. Spaniards in particular are famous for being rather stubborn and non-entrepreneurial to a fault. I for one have been pushed out of a store right at closing time right here in Valencia, only to see the same place close its doors for good a few weeks later. Many insightful articles have been written about this strange phenomenon – by expat Spaniards mind you – and it often seems to me that the average Spaniard seems to be impervious to the economic realities of supply and demand.
I would actually be interested to hear how 2020 has affected real estate as well as rental prices (short or long term) in your own locality. Are property owners and hosts adjusting to this new reality or are they desperately, and perhaps foolishly, clinging to the good times that seem to have disappeared into the distant past at the onset of 2020?
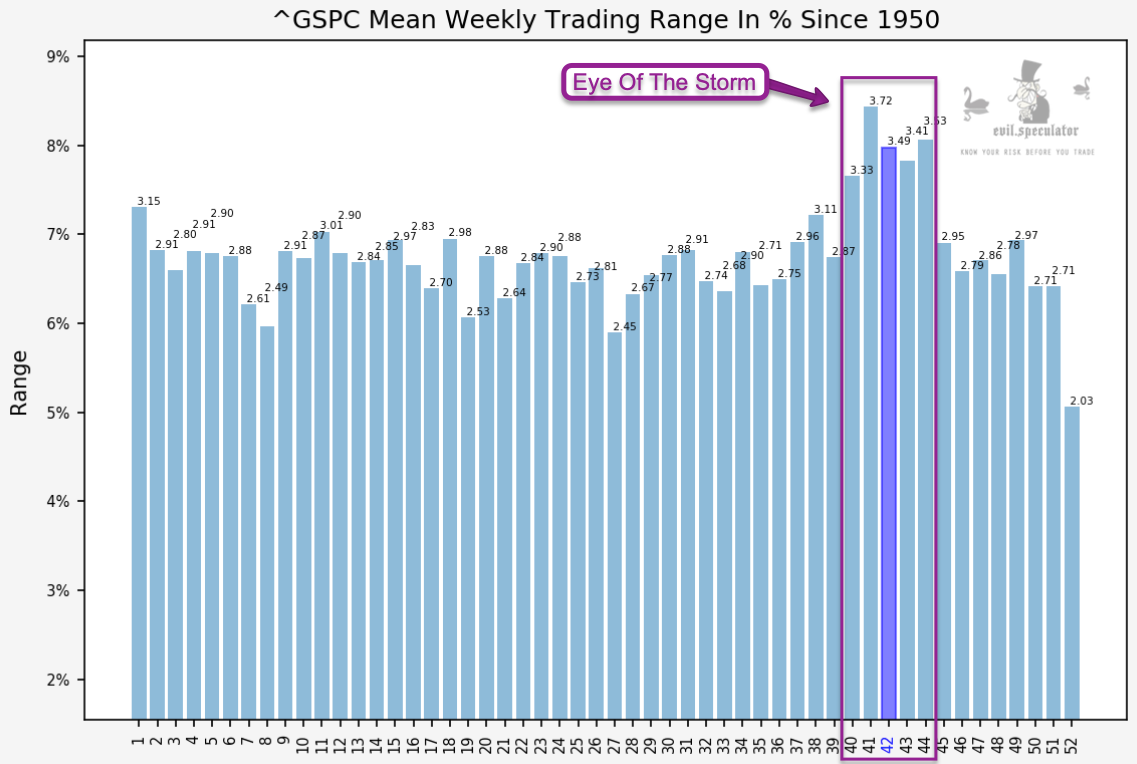
Alright, let’s get to the weekly stats. At least when it comes standard deviation (which I explained in detail last Monday) we seem to be rolling over the hump now. For me week #42 always signals the beginning of the last quarter with the coveted Santa earnings season slowly peaking over the horizon. Of course it’s 2020 so anything may happen before and right after November 3rd.
When it comes to the trading range (on a percent basis) we however seem to be in the eye of the annual storm. If I count correctly the presidential elections are scheduled for week #45, so I don’t expect that one to be anywhere near 2.95, but much higher.
More fascinating stats and market analysis waiting below the fold for my intrepid subs:
[MM_Member_Decision membershipId='(2|3)’]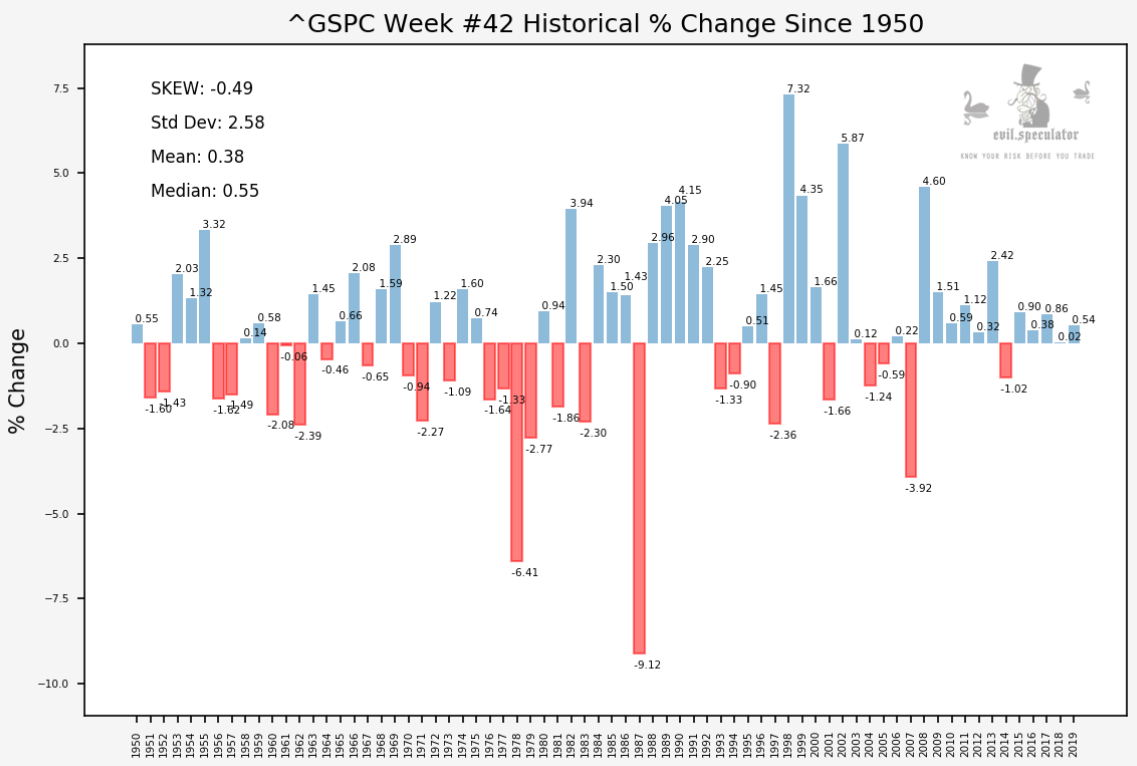
Percent change since 1950 shows us a slow change over the past decade. This used to be quite a volatile week with downside outliers dominating up into the 1980s. But that has slowly changed ever since and especially when QE started to take off in earnest.
Also notable however is that the squeeze seems to produce a lot less squeeze since 2008 as well. So although there is an upside bias I would not bet on any outliers this week.
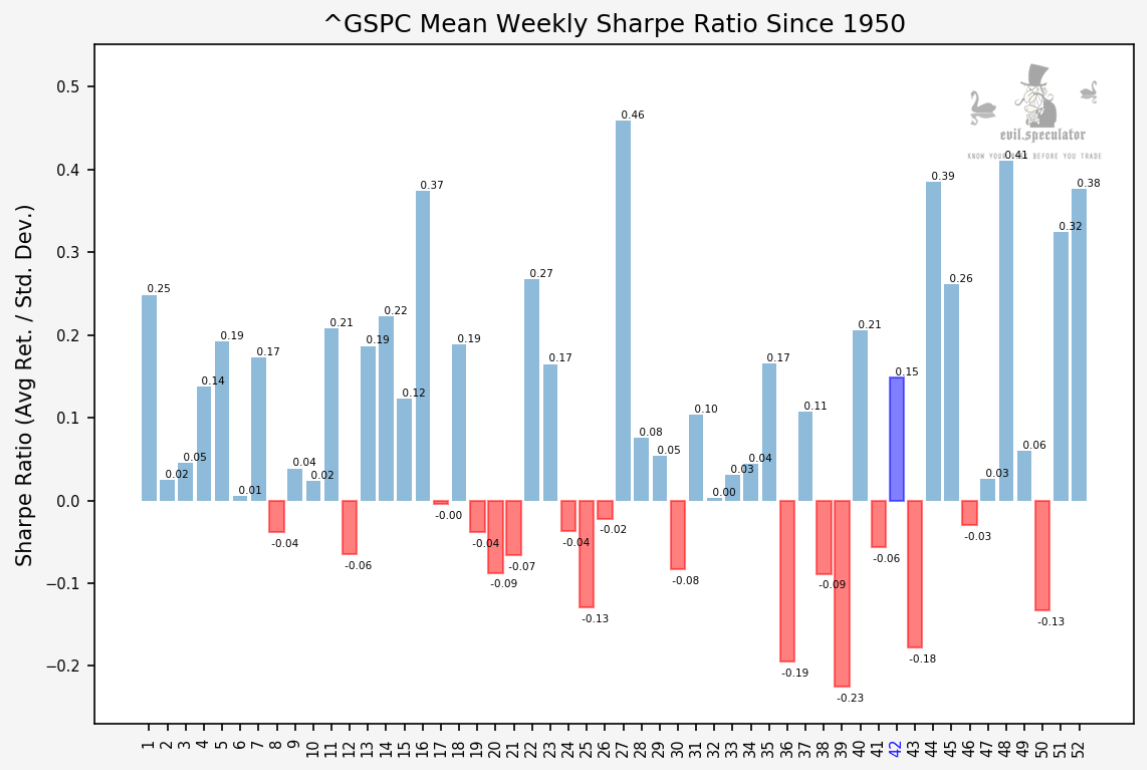
Sharpe ratio is positive at 0.15 and probably higher over the past decade or two.
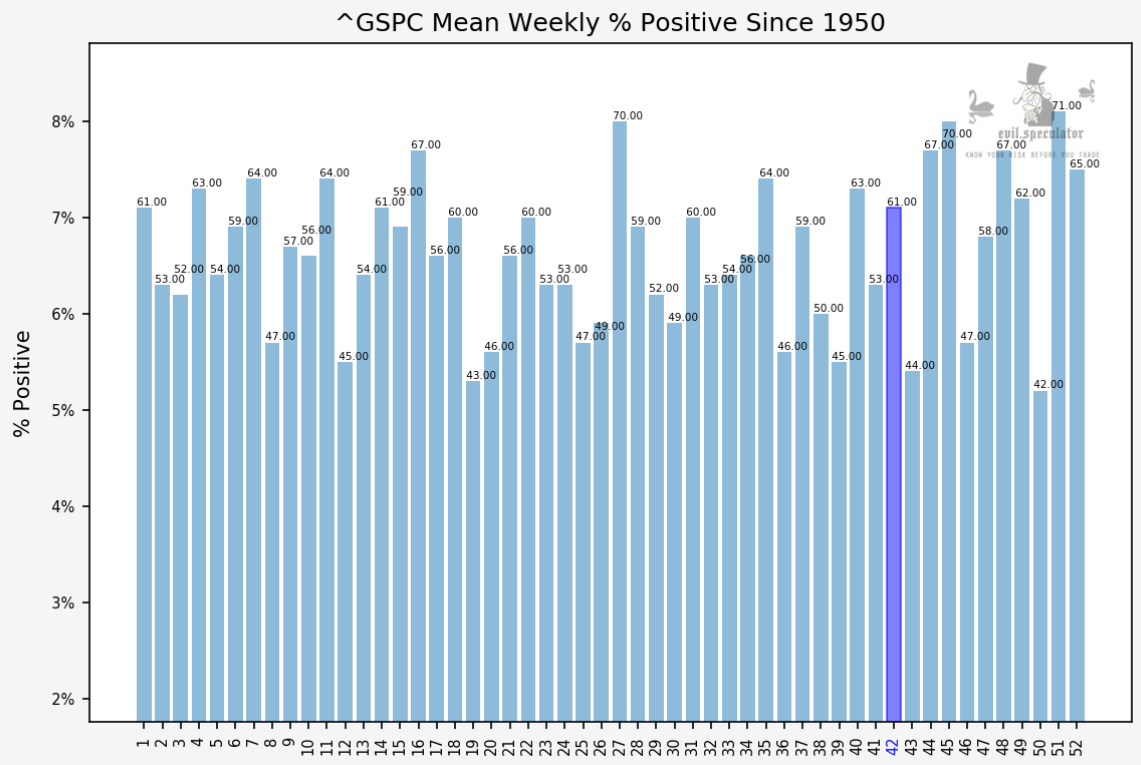
Percent positive at 61% – I like those odds. And once again those seem to have shifted toward the bullish side since the onset of QE by the Federal Reserve in 2009.
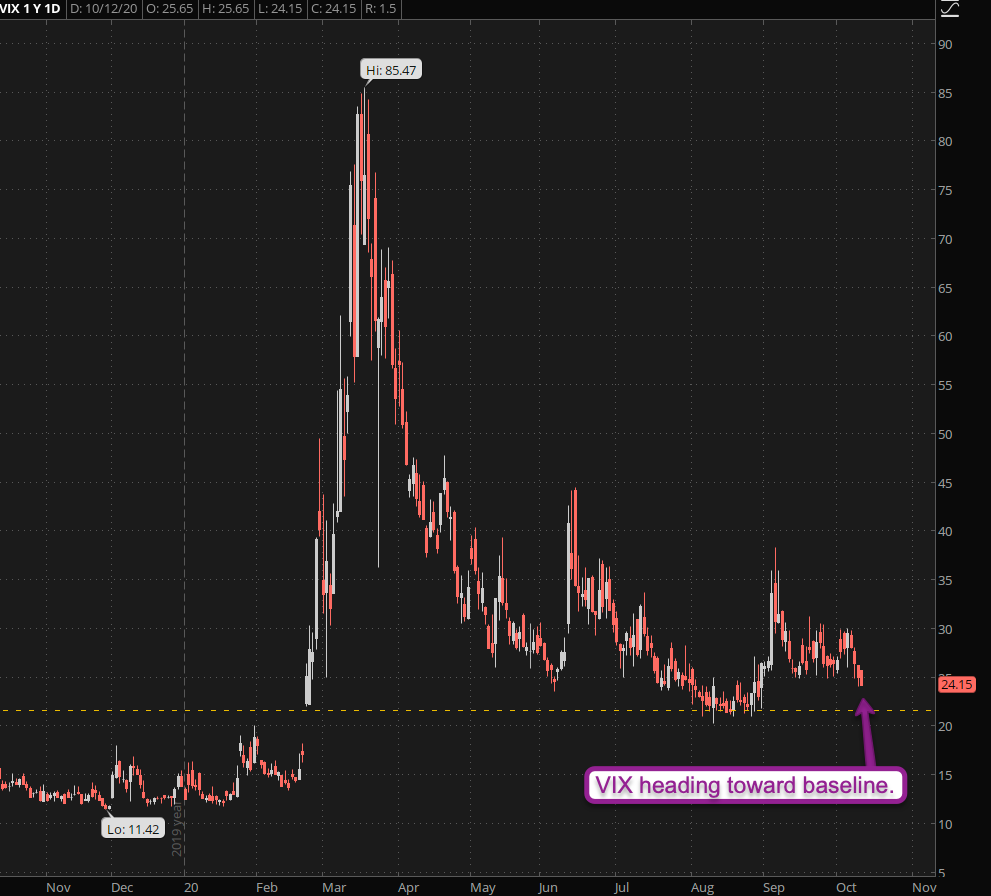
Let’s talk implied volatility starting with the VIX. It’s starting to drop below the 25 mark which thus far seemed to have formed a second baseline. I do expect it to slow down near the 22 mark however, especially ahead of the elections.
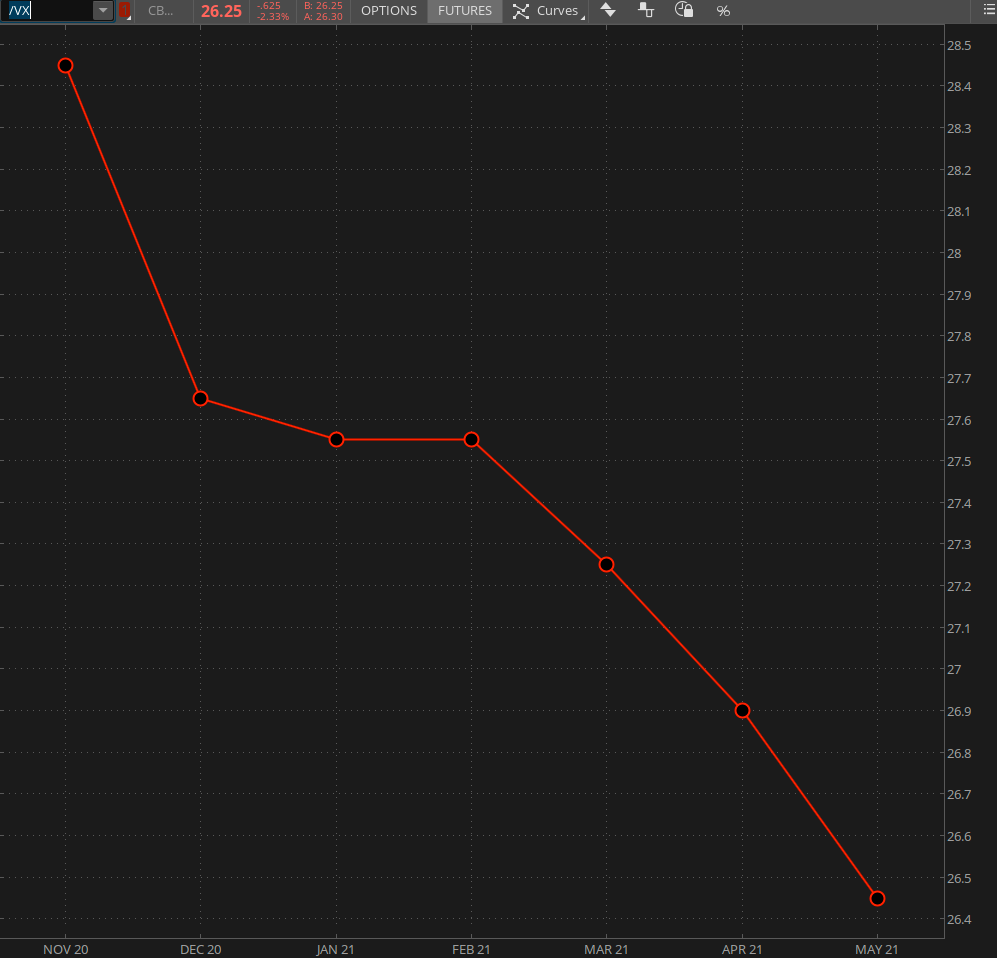
VX futures product depth – we are no in the November contract and we continue to observe consistent backwardation all the way into next May.
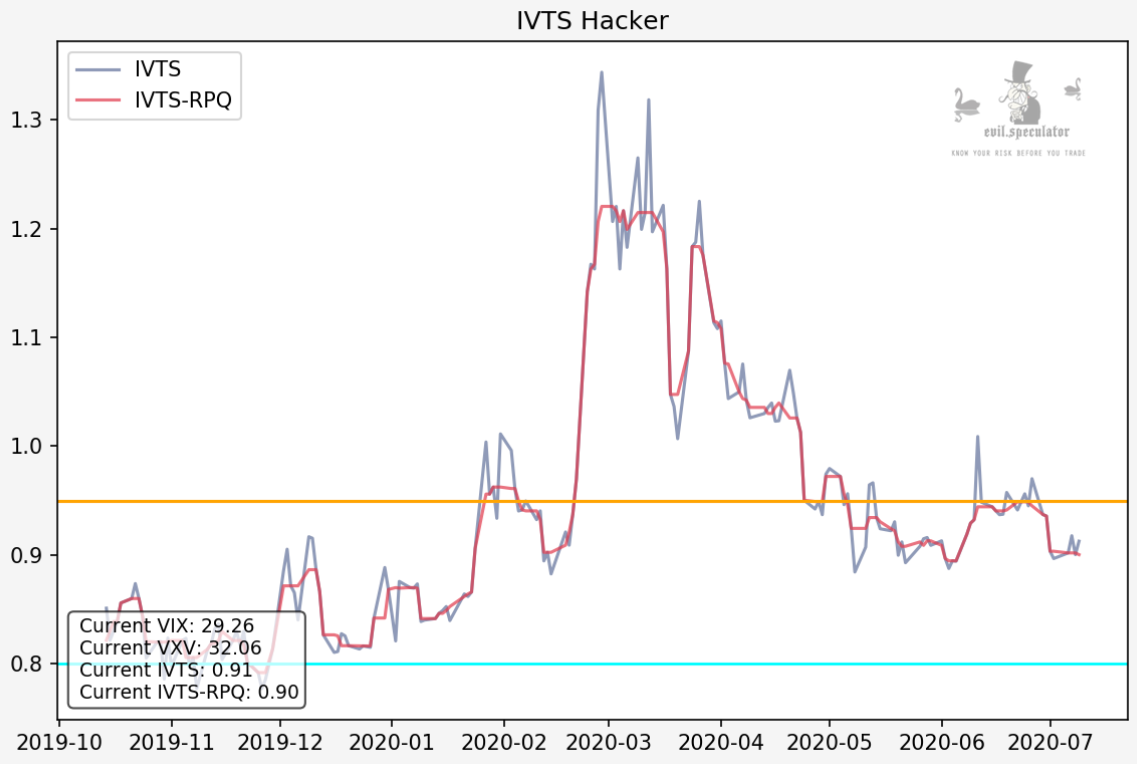
The Implied Volatility Term Structure (IVTS) on the other hand has been rather tranquil over the past few months. This incidentally does support the bullish sceneario.
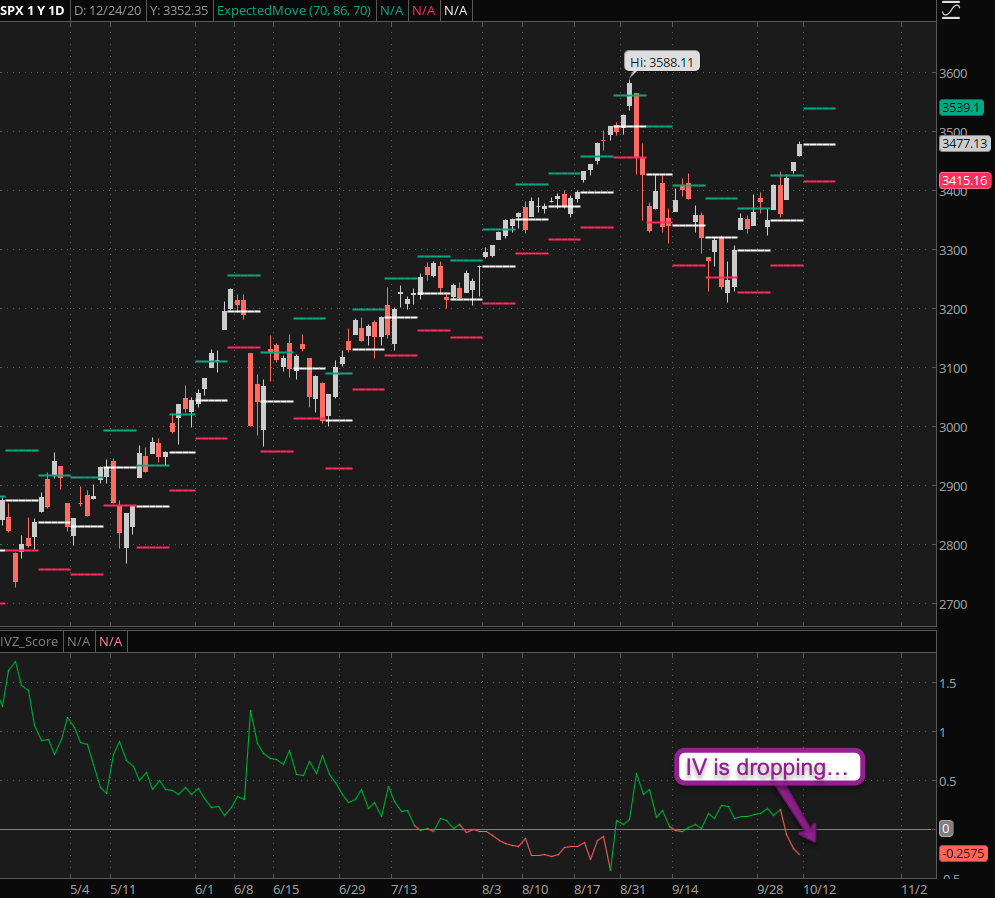
Expected move for the week on the SPX is around 62 for the weekly contract expiring this Friday. The IVZ-Score is dropping as well – again very interesting given that the VX futures still point toward turbulence ahead. Perhaps if everyone is expecting chaos delivering the opposite would be final FU to all the doomers and gloomers? 😉
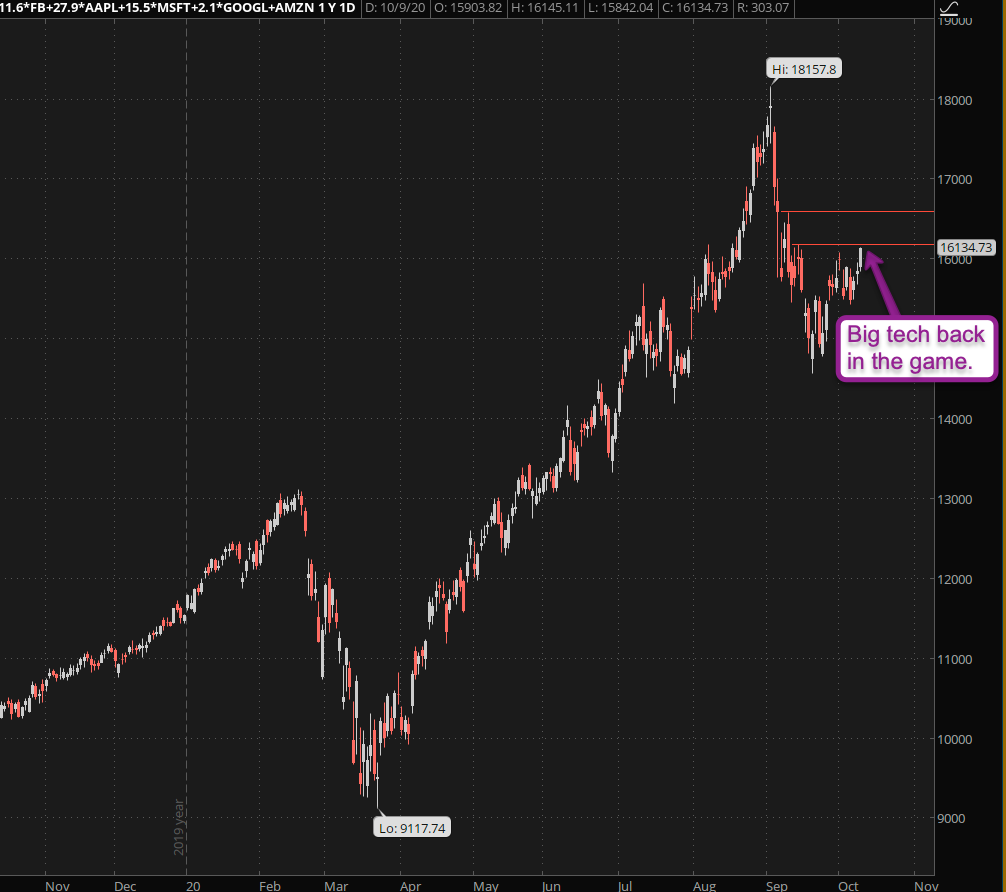
Finally it seems that my monsters of tech composite is pushing toward an important inflection point. If it can be breached then I think we are go for a push toward those all time highs. I hope you grabbed a bit of long exposure a few weeks ago when I kept talking about early entry opportunities.
Besides big tech basically runs the overall market at this point, so wherever these five symbols go everyone else goes.
Happy hunting but keep it frosty.
[/MM_Member_Decision] [MM_Member_Decision membershipId=’!(2|3)’] Please log into your RPQ membership in order to view the rest of this post. Not a member yet? Click here to learn more about how Red Pill Quants can help you advance your trading to the next level.[/MM_Member_Decision] [MM_Member_Decision isMember=’false’] Please log into your RPQ membership in order to view the rest of this post. Not a member yet? Click here to learn more about how Red Pill Quants can help you advance your trading to the next level.
[/MM_Member_Decision]


