As equities remain on cruise control and there’s really not much new to report on the daily front I decided to take a peek at some of my longer term momentum charts. The ones that stood out all relate to market breadth, which refers to the ratio between advancing stocks vs. declining stocks. But why would we care about that?
The breadth of market theory is a technical analysis methodology that predicts the strength of the market according to the number of stocks that advance or decline in a particular session, or how much upside volume there is relative to downside volume.
We’ve had upside volume galore especially given that we’re still at the tail end of the summer season. But over the past few weeks I’ve been rather prolific about the fact that big tech is increasingly and heavily dominating equities. Everything else simply pales in comparison.
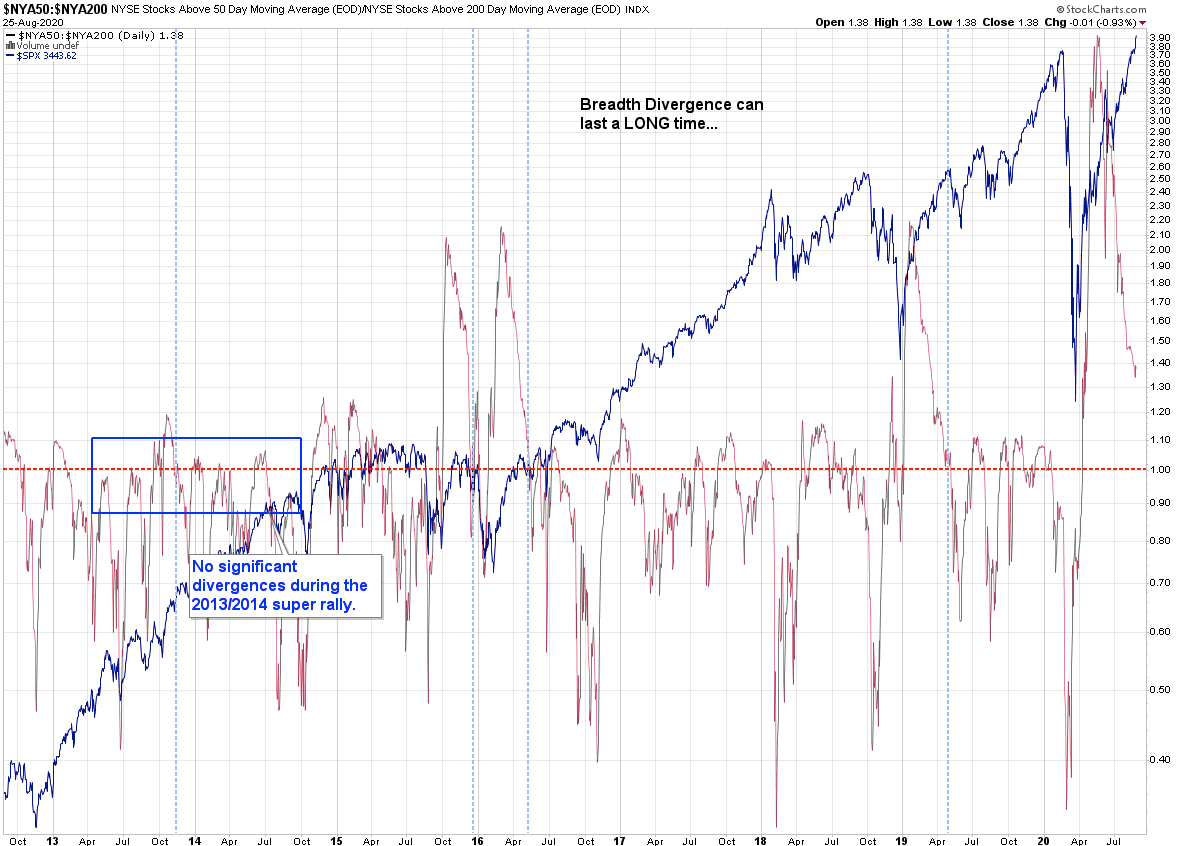
Looking at the chart above you see the SPX plotted behind NYSE market breadth. I’ve mentioned on many occasions that extreme signals can maintain much longer than you can remain solvent.
Per the situation in the here and now, as you can see we’ve got a long long way to go until we’re even getting close to the 1.0 mark. So if you’re feeling bearish you may want to hold your horses.
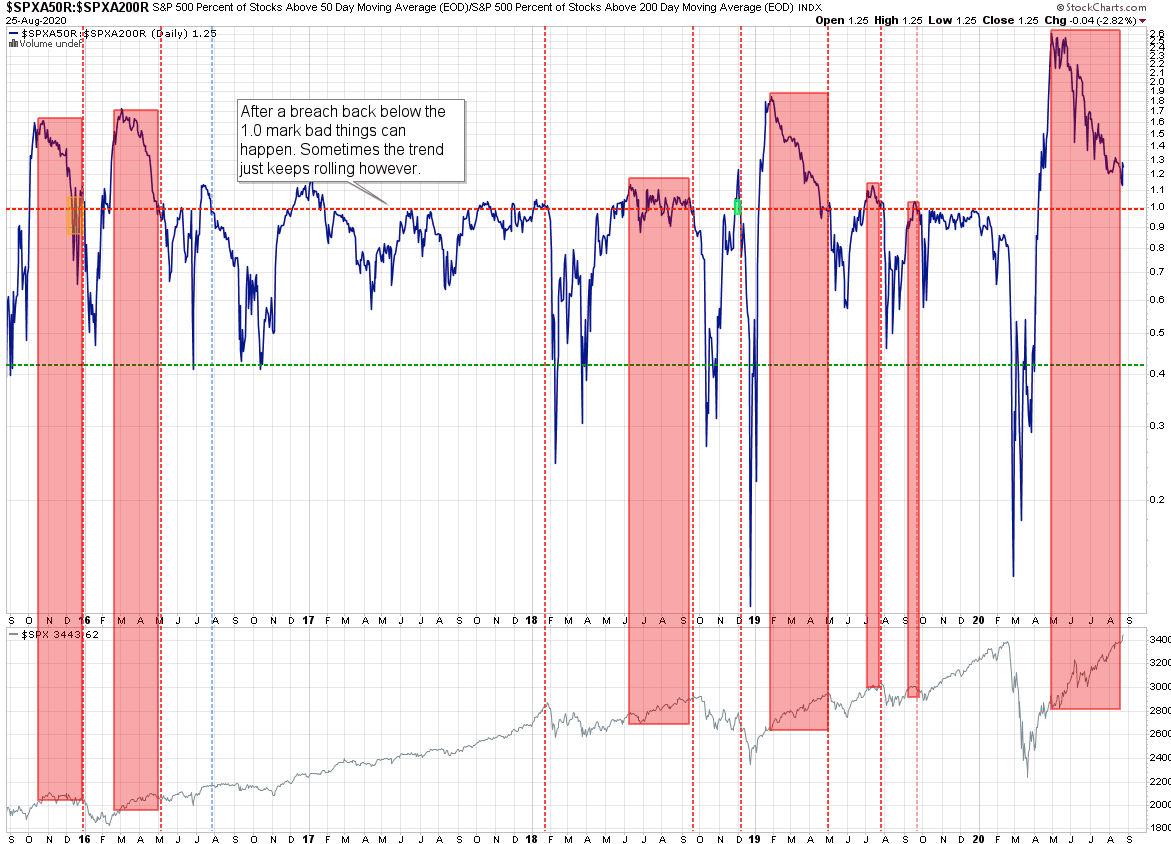
Here’s a similar market breadth chart but against the S&P 500 cash, a.k.a. the SPX. I think the vertical lines I drew tell the story and require little explanation. This has been a pretty reliable long term indicator and extremely helpful when it comes to putting the overall trend into context.
[MM_Member_Decision membershipId='(2|3)’]
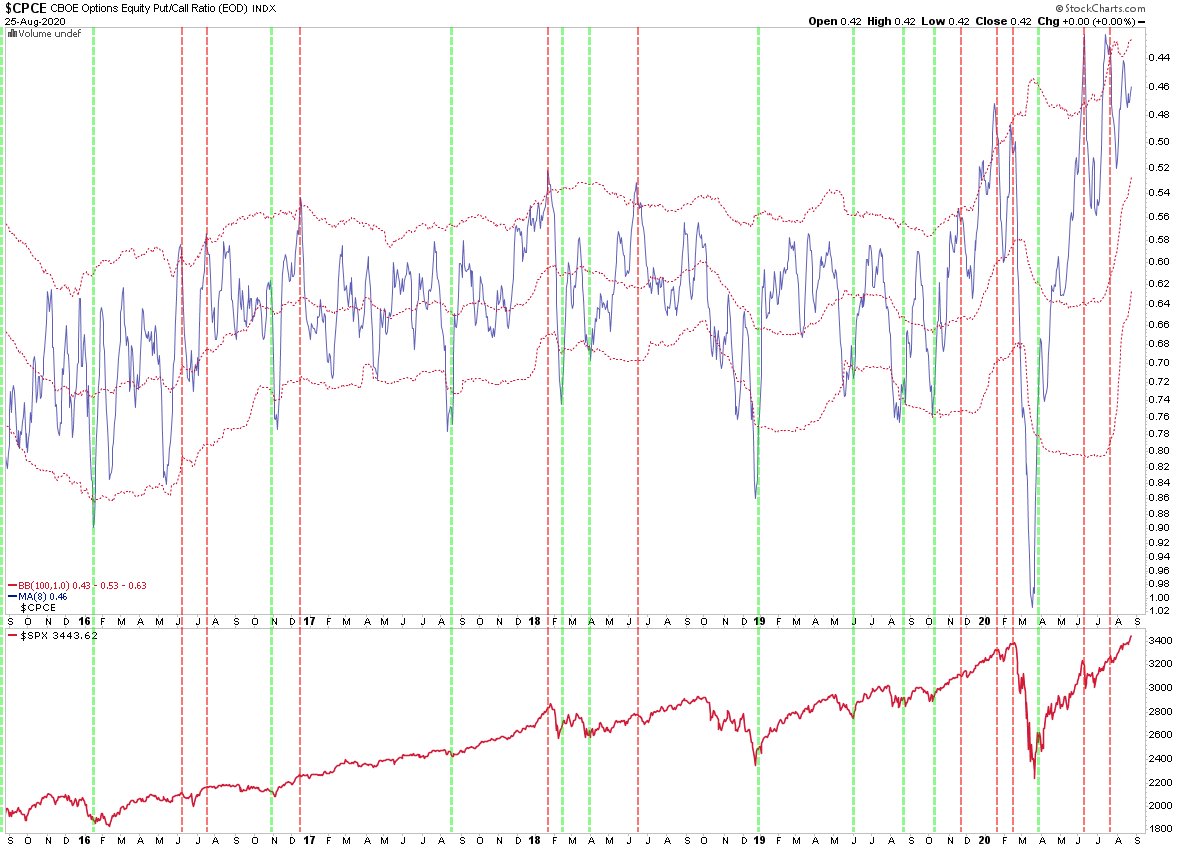
The CPCE shows us the flow of the put/call ratio courtesy of the CBOE. Once again long term turning points seem to be mostly observed. Unfortunately the scope/scale of the ensuing correction (or bounce back) is difficult to predict but it’s a long term chart and odds have it that we would exit our positions way in advance.
Long term entries always look like a no-brainer in hindsight but most traders get shaken out of winning positions due to the daily noise and often impatience or inexperience.
As for the current signal you may appreciate the difficulty of plotting a path forward. After a six month face ripping rally the Bollinger is rising quickly which makes establishing a reversal threshold very difficult. My money is on the market breaking way before this would ever occur as we’re getting pretty extended here.
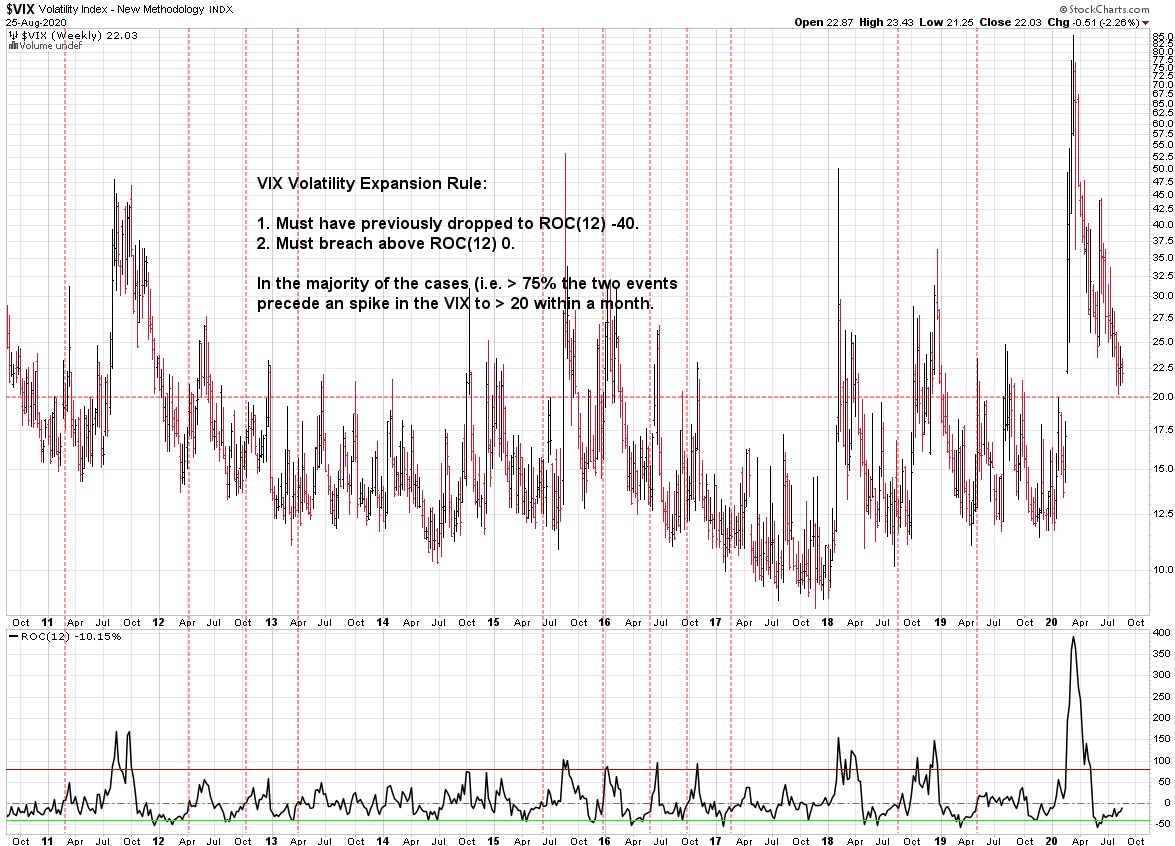
I entertain many perspectives on the VIX as analyzing implied volatility has sort of become a hobby of mine and Tony in particular. On a long term basis I usually look at signal extremes that breach a particular threshold and then perhaps a second one for confirmation.
In the case of the VIX the ROC (not an indicator I often use) seems to be doing the trick as a rise above the 0 mark from -40 usually represents an early harbinger of IV expansion. As you can see we’re getting closer but there’s a bit of a problem.
Which is that the VIX never dropped below 20 in the first place. So would a breach > 0 suggest the VIX will explode above 30 or more? I frankly do not know – it’s possible or perhaps the market would simply ignore it all and happily plot higher.
Bottom Line
This is not your daddy’s bull market. It’s lop sided and effectively fueled by extreme expansion of our monetary base. Investors as well as traders are chasing the only game in town, which is big tech, precious metals (until recently) as well as crypto (good luck with that when the lights go out).
That said – no reason to over think this. As the old saying goes: It ain’t over until the fat lady sings. Maybe not politically correct in 2020 but it makes the point that front running a possible correction just because your fancy lines on your charts tell you so could turn into a costly and frustrating exercise.
[/MM_Member_Decision] [MM_Member_Decision membershipId=’!(2|3)’] Please log into your RPQ membership in order to view the rest of this post. Not a member yet? Click here to learn more about how Red Pill Quants can help you advance your trading to the next level.[/MM_Member_Decision] [MM_Member_Decision isMember=’false’] Please log into your RPQ membership in order to view the rest of this post. Not a member yet? Click here to learn more about how Red Pill Quants can help you advance your trading to the next level.
[/MM_Member_Decision]


