I was born with a fairly pale complexion which has always forced me to stay out of the sun lest I end up looking like a roasted chicken after only minutes of being exposed to a UV index anywhere above 5. It’s not that I hate the sun – rather the sun seems to hate me, or at least it hates my skin as it insists on burning it. As a financial blogger who also trades for a living it’s easy to understand that summer is my least favorite season of the year.
And while July and September are somewhat tolerable it’s August in particular I’m always happy to say goodbye to. The fact that everything here in Spain shuts down for the entirety of the month does not really help matters. Oh and I should probably also mention the high humidity here ranging in the 80 percentile or higher.
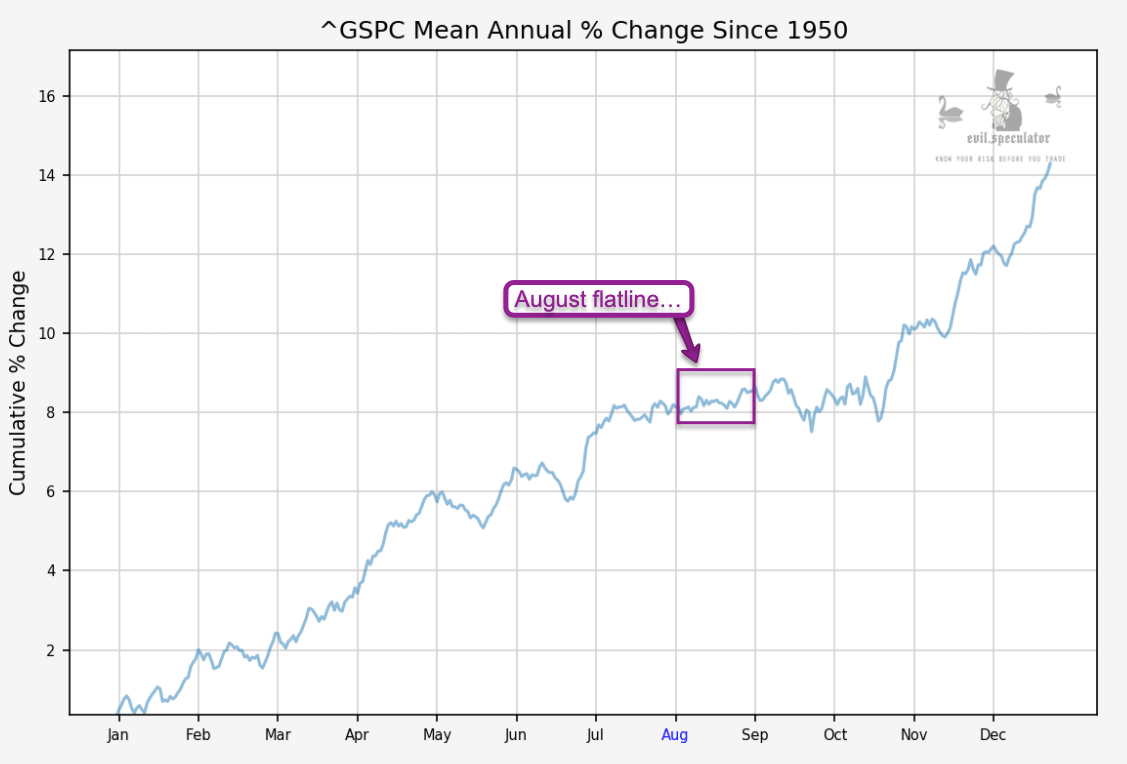
Let’s talk charts. The mean annual % change over the past 70 years shows us a complete flatline on average, which is great for selling theta to option trading retail suckers but is pure Kryptonite for anyone trying to report anything interesting about the financial markets.
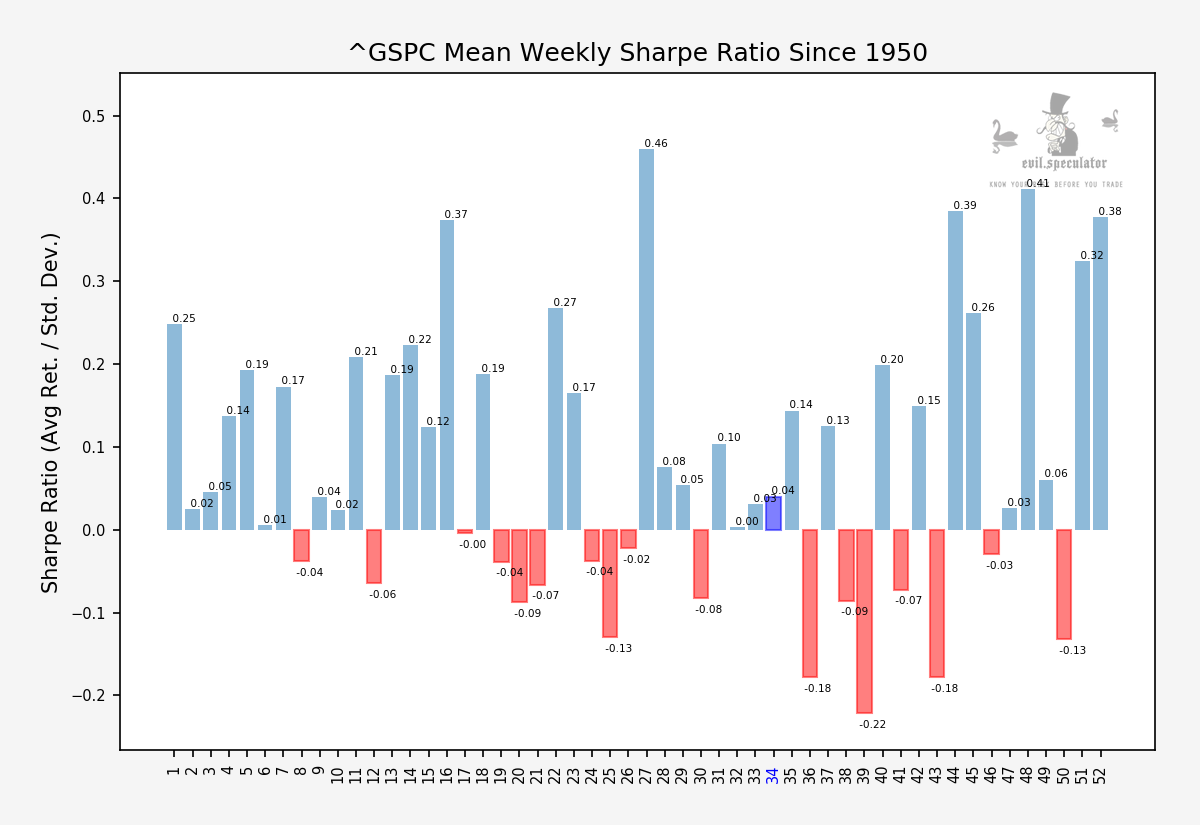
Fortunately things are starting to get a wee bit more interesting – next week that is – not in week #34 which only shows us a Sharpe ratio of 0.04. In the second half of 2020 that may of course be enough to push us toward new all time highs in equities. If not this week then my money is on week #35 which is the most bullish statistically for all of summer.
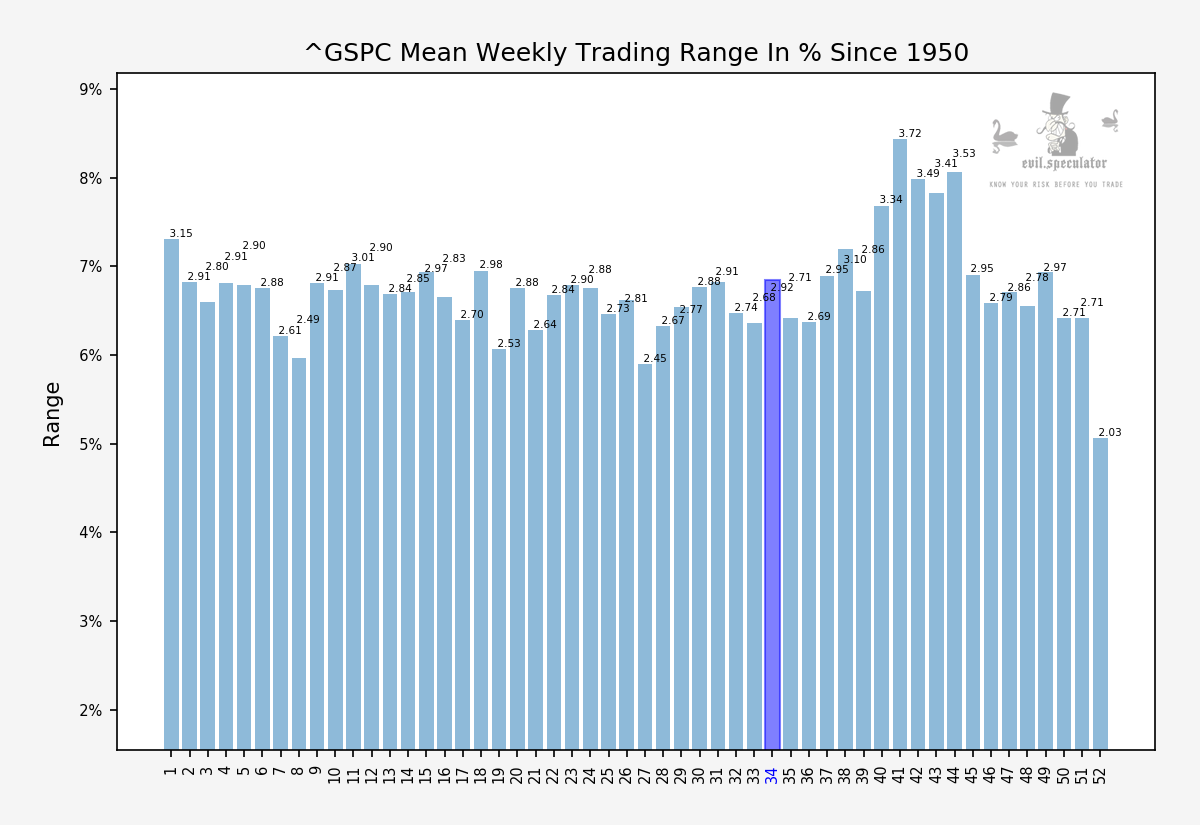
Trading range is slightly elevated given that we’re in a flat season, so expect a lot of noise with no clear directional bias. Basically the type of tape we’ve seen for the past 2 weeks.
More weekly stats plus a quick medium term update below the fold for my intrepid subs:
[MM_Member_Decision membershipId='(2|3)’]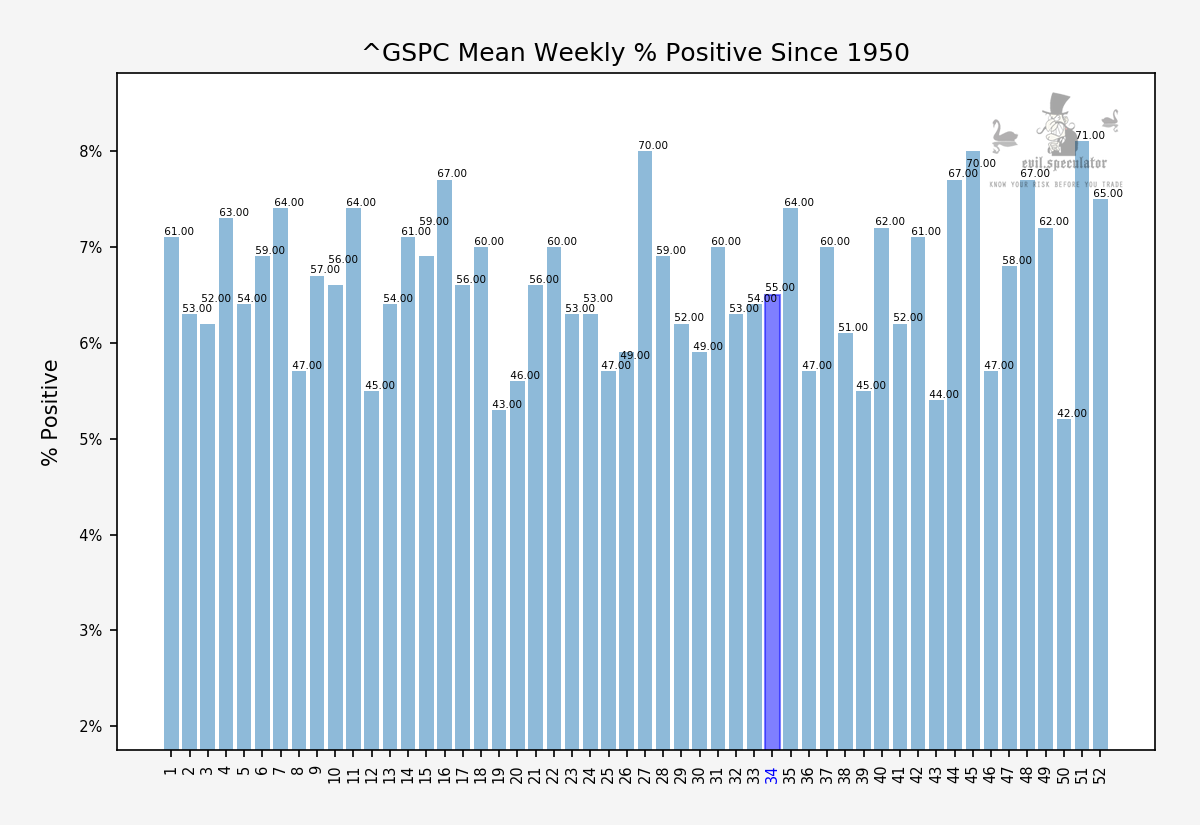
I guess a percent positive of 55% is simply par for the course. Better than 50% of course but not exactly much to write home about, innit? 😉
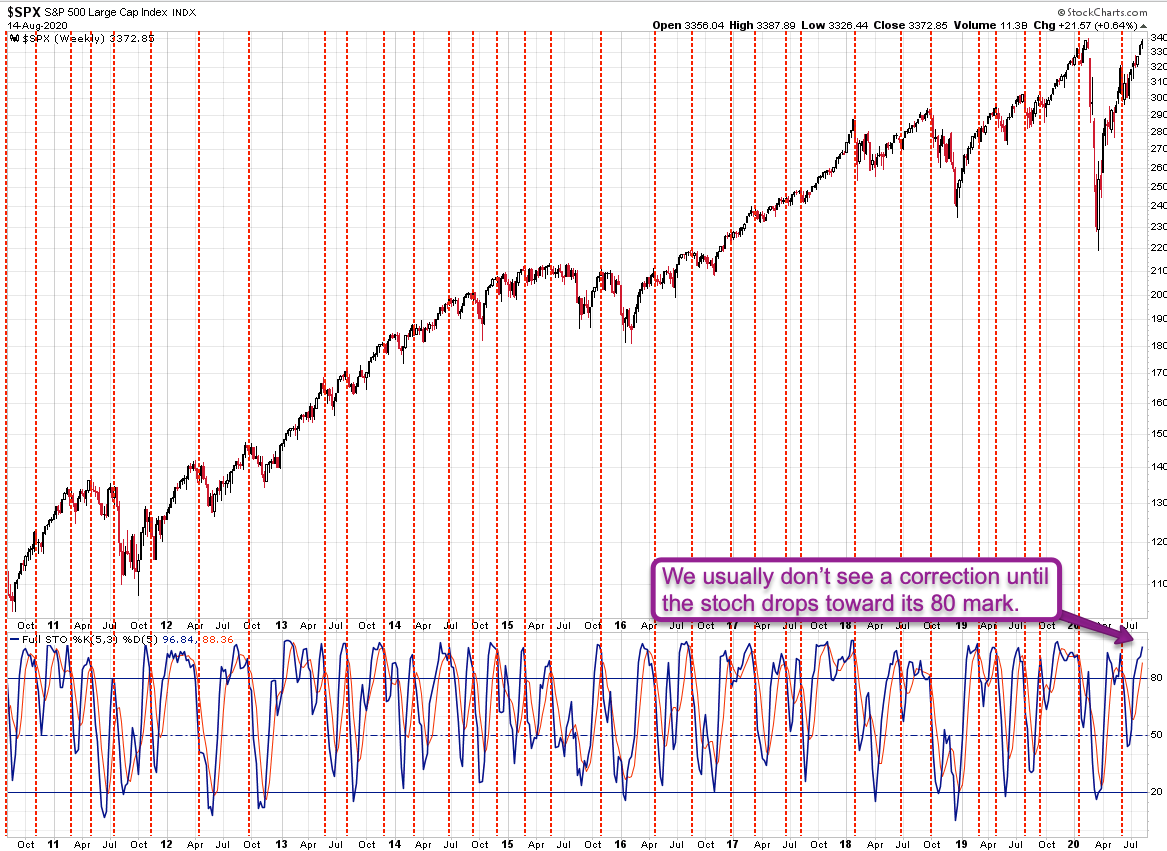
Here’s a chart I’ve been tracking for over a decade now and it’s the only one that dons a stochastic indicator. Why would I resort to such technical tea leafing? Well because it’s rarely let me down, that’s why.
As you can see over the years it’s been extremely good at warning us about medium to long term sell offs. At the current time it’s showing us an extended signal but we are far far from even approaching the fateful 80 mark.
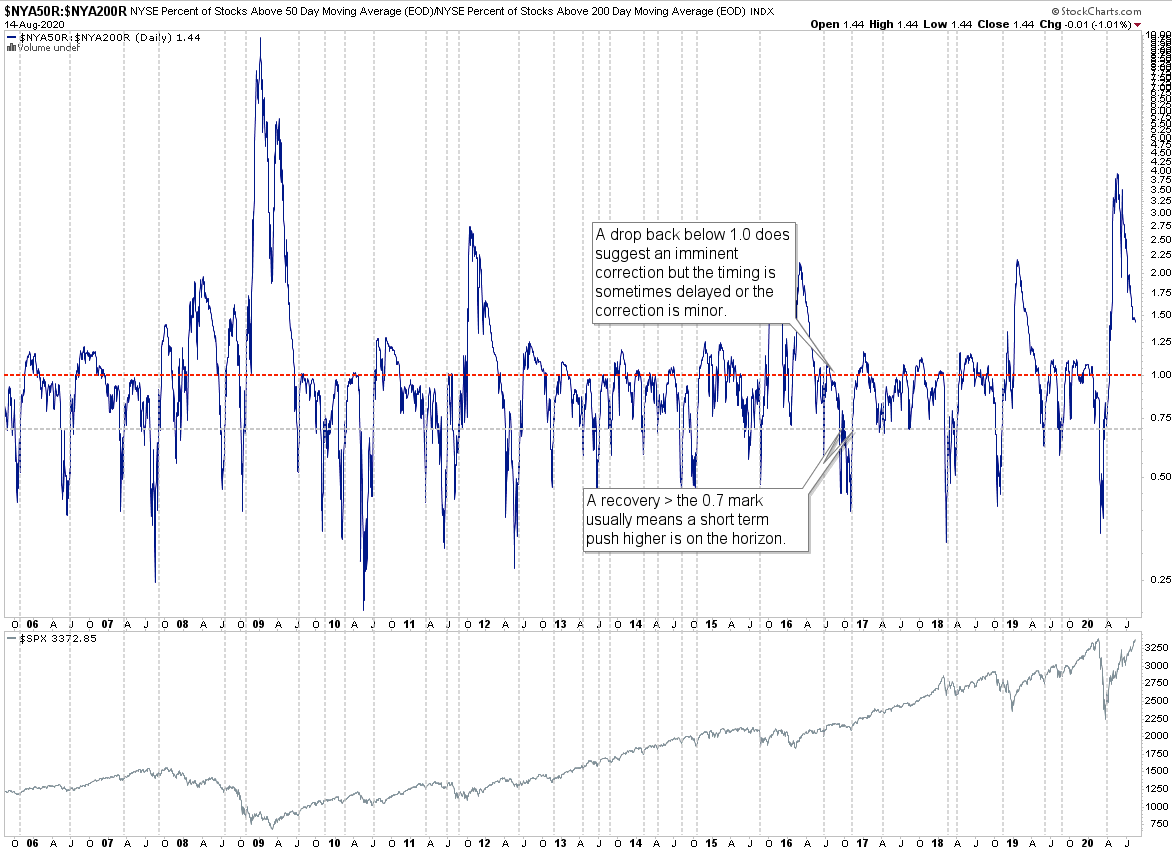
NYSE market breadth tells a similar story. The 1.0 mark is usually when the gravity begins to exert its influence but there’s a long way to go.
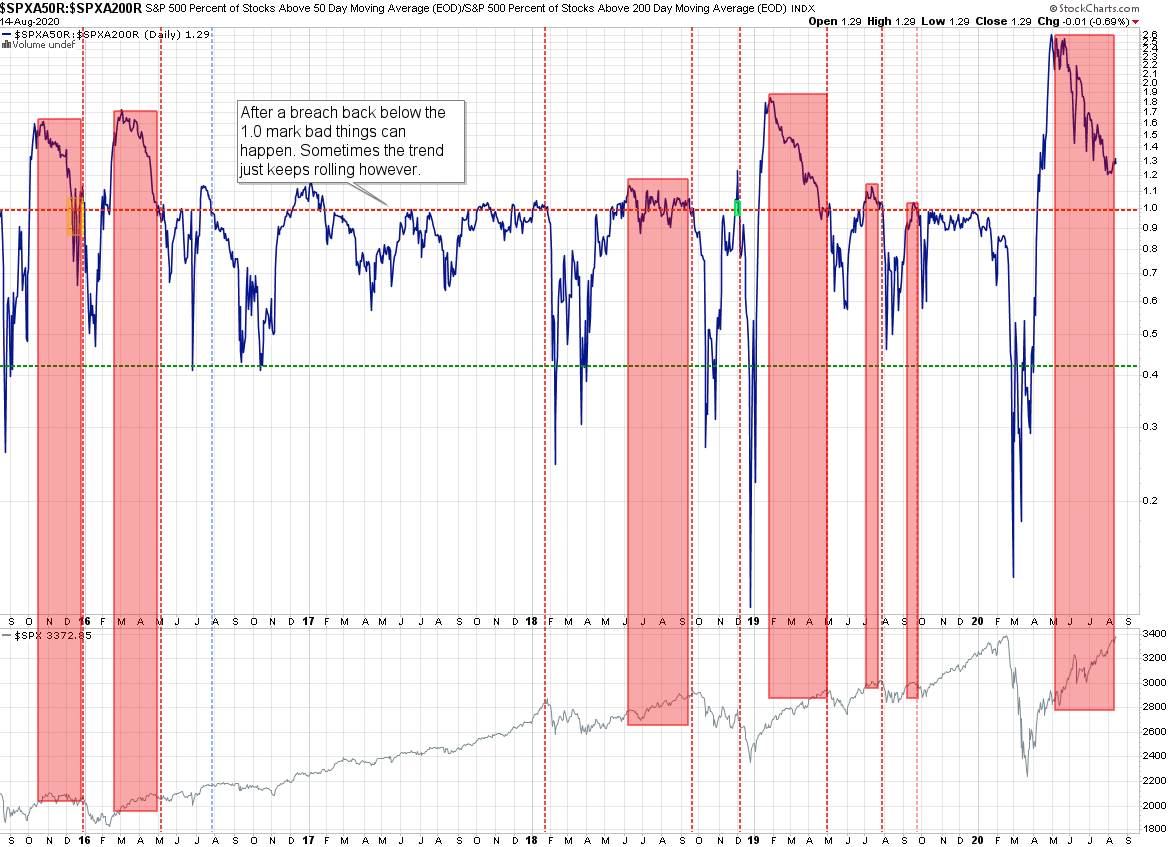
Breadth on the SPX seems to agree – again, this is a medium to long term chart and it ignores small little wiggles. The periods to pay attention to are the ones highlighted in pinkish red.
After a signal peak has been marked we usually see slow degradation until a breach of the 1.0 mark when price usually responds. Getting short ahead of time can turn into a very costly proposition.
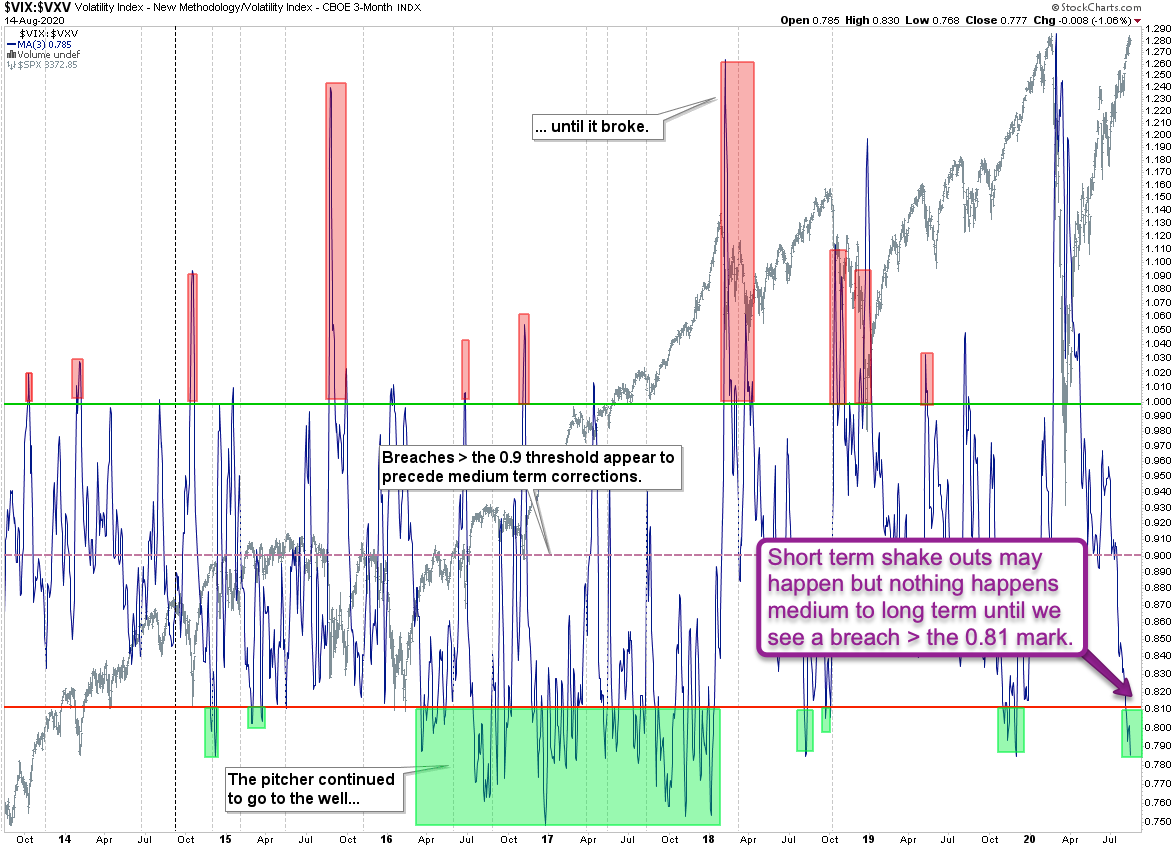
Finally a long term perspective on the IVTS – the implied volatility term structure. We are back in lower short squeeze zone below the 0.81 mark. It’s very difficult to predict how long we remain here – the two years between early 2016 and late 2018 is more of an exception than the norm.
What we do know is that a breach back > the 0.81 mark serves as a 1st warning. Once 0.9 is taken out that’s usually when the real fun begins. At this point there’s little reason to assume this will happen anytime soon.
[/MM_Member_Decision] [MM_Member_Decision membershipId=’!(2|3)’] Please log into your RPQ membership in order to view the rest of this post. Not a member yet? Click here to learn more about how Red Pill Quants can help you advance your trading to the next level.[/MM_Member_Decision] [MM_Member_Decision isMember=’false’] Please log into your RPQ membership in order to view the rest of this post. Not a member yet? Click here to learn more about how Red Pill Quants can help you advance your trading to the next level.
[/MM_Member_Decision]


